Accurate interpretation of the cause or causes of a forest change or phenological pattern typically requires supportive information. Many of the datasets available in the Forest Change Assessment Viewer for this support are independent products that have been produced by a number of different organizations. Some of these are captured as near real time Internet feeds, some are periodically updated, and others are fixed products. The list below credits and describes products that have proven useful for attribution purposes in the past.
False positives
- ForWarn eMODIS Cloud Assessment Product—Clouds and smoke from wildland fire can reduce NDVI, giving the false appearance of disturbance. Found in the Assessment Viewer, these true color maps show the same pixels used in the forest change maps. White or grey tones indicate clouds and a false positive for disturbance.
- Snowpack—ForWarn’s forest change products include areas of heavy snow as a distinct color, but light snow cover can also reduce NDVI. In addition to this legend, National snowpack maps may be useful for evaluating potential snow effects. A National Weather Service snowpack archive and regular updates are available here: http://www.nohrsc.noaa.gov/nsa/.
Forest disturbance maps and datasets
- MODIS hotspots showing recent fires—Large fire incidents and cumulative satellite fire detections for the current year are available in near real time from the Forest Service Remote Sensing Applications Center’s (RSAC) Active Fire Mapping Program. http://activefiremaps.fs.fed.us/.
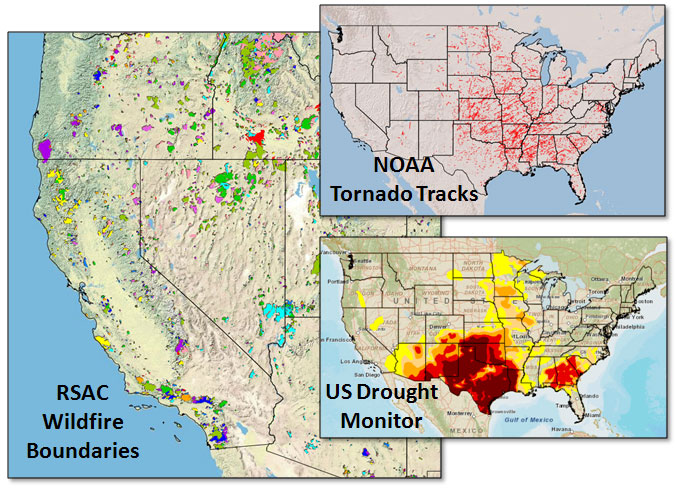
- Historical wildfire perimeters—Maps showing the extent of past fires are periodically updated in the Assessment Viewer using data provided by the Monitoring Trends in Burn Severity (MTBS) project of RSAC and the RSAC-USGS GEOMAC effort. http://www.mtbs.gov/index.html; http://www.geomac.gov/.
- Active fire maps—Detailed information on the status of active wildfires and large prescribed fires is available on the Incident Information System (Inciweb) website. Their fire progression maps are not included in the Assessment Viewer http://www.inciweb.org/.
- Historical insect, pests and disease maps—The Forest Health Technology Enterprise Team (FHTET) conducts aerial disturbance surveys for a portion of US forests every year from aircraft. These are useful for understanding the pattern and landscape position of past mortality and defoliation events, and the specific agents that are known to occur. http://www.fs.fed.us/foresthealth/technology/.
- Pest Proximity Database—The Pest Proximity database developed by the Eastern Forest Environmental Threat Assessment Center helps determine which insect and disease agents are most likely to occur for a given portion of the US based on a gridded neighborhood analysis of the biotic agents documented by historical FHTET Aerial Disturbance Surveys. http://forwarn.forestthreats.org/news.
- Flood data—River and stream gage data can confirm the existence and severity of flooding. These are not available in the Assessment Viewer. Near real time data are available here: http://waterdata.usgs.gov/.
- Weather disturbance data—Historical tornado tracks and hail swaths from NOAA’s National Weather Service are useful for monitoring post-disturbance recovery. http://www.spc.noaa.gov/gis/svrgis/.
- Fuels Treatments—provides data to map fuels treatments, for example for thinning and prescribed fire, on National Forests and Grasslands from 2000 to the present. (see ‘Hazardous Fuel Treatment Reduction: Polygon’, at http://data.fs.usda.gov/geodata/edw/datasets.php)
Climate and weather datasets
- US Drought Monitor—This climatic stress mapping effort shows the location of dry, moderate, severe extreme and exceptional drought in near real time. Both current and archived data are available. For assessments of regional drought conditions and drought predictions, visit this project’s website: http://droughtmonitor.unl.edu/.
- Recent precipitation—The Tropical Rainfall Measuring Mission (TRMM) provides 10 day precipitation maps for the US. http://trmm.gsfc.nasa.gov/.
- Percent of normal precipitation—ForWarn includes modified PRISM maps (http://www.prism.oregonstate.edu/) that show monthly rainfall anomalies.
- VegDRI—The Vegetation Drought Response Index (VegDRI) project relates near real time weather conditions to effects on the ground. These supportive data show climate stress and meteorological data such as days with precipitation. http://vegdri.unl.edu/.
- RAWS weather station data—Archived and near real time weather data for rural stations are available through the Remote Automated Weather station network. These have been useful for documenting daily temperature extremes in fall and spring. http://www.raws.dri.edu/.
- NCDC Drought Indices—For rapid comparisons of four different monthly drought indices, the National Climate Data Center’s high quality station data is quite useful. Drought animations can be easily tailored to the different baseline years used in ForWarn’s change products. http://www.ncdc.noaa.gov/temp-and-precip/drought/historical-palmers.php.
For more information on the data layers used go to the Forest Change Assessment Viewer Users Guide.