The near-real-time monitoring need
Our response to disturbances such as wildfire, pests, wind or ice storms is often limited by knowing where the disturbance occurred. Existing disturbance tracking programs were not designed to track all forest or other vegetation types at high frequency, and this can contribute to delays in awareness, and if warranted, response. With its 8-day product frequency, ForWarn can recognize ephemeral biologically important disturbances that in some cases may go entirely unnoticed.
The systematic use of broad-scale remote sensing is different than past approaches to remote sensing that were designed to assess isolated disturbance events. For example, when and where large wildfires occur, burn severity assessments help land managers decide where to stabilize soil and mitigate suppression activities. Similarly, when hail or tornadoes strike populated areas or croplands, emergency efforts map the area affected to efficiently channel resources where they are needed most. In contrast, ForWarn tracks the entire landscape, all the time. In this sense, continuous monitoring from remote sensing is akin to the plot-based Forest Inventory and Analysis (FIA) program, although ForWarn is at 5.4 hectare resolution and updated weekly.
Historical baselines
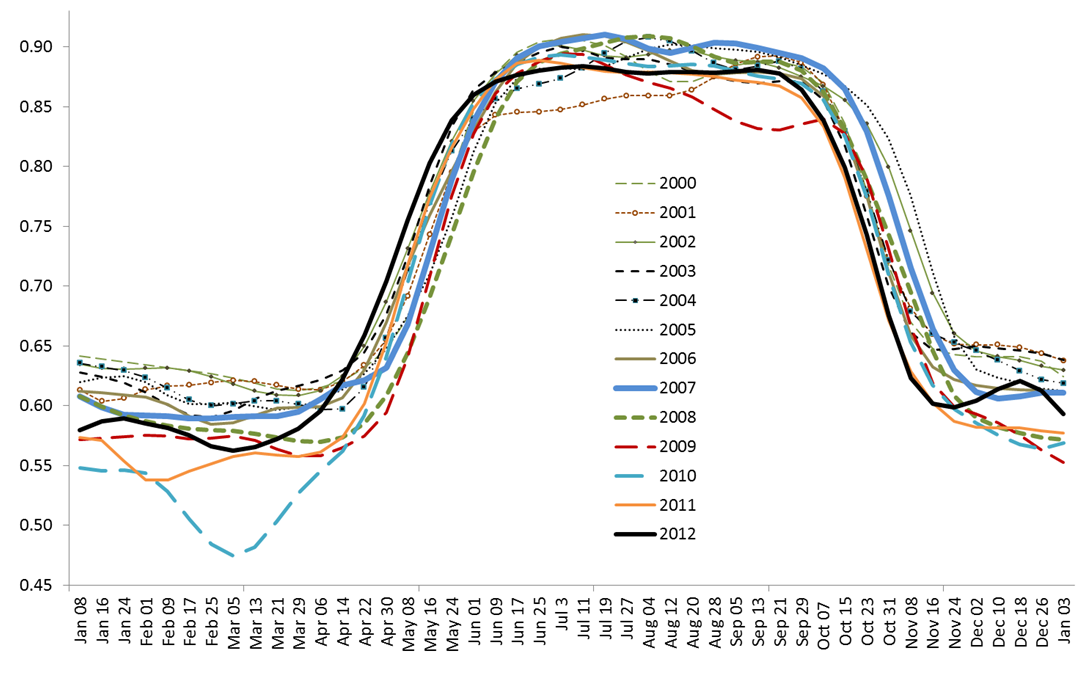
ForWarn’s near-real-time products compare current NDVI to seasonally-appropriate NDVI values derived from it historical NDVI database. Historical baselines have been devised to capture the diverse needs of assessors and the different ways that change manifests itself across disturbances and vegetation types. Rather than presume that a single date or condition in the past is normal, ForWarn’s suite of baselines provide different contexts or perspectives on the current condition, and in many instances, more than one baseline gives the assessor the necessary insights to help diagnose the cause of the change and its implications.
NDVI values can reflect both disturbances and climate variation. Some baselines are more relevant than others for understanding which of these two causes is at work. The 3 year and All year maximum baselines provide the highest greenness observed for that period, and so approximate the concept of potential vegetation in a disturbance-free and climatically optimal year (although only within the 2000 to prior year time frame). Areas that were disturbed in 2001 (or thereafter) will have a lower NDVI than they did in 2000 until they recover. Therefore, baselines that use the max are a useful way to identify areas of disturbance.
However, maximum baselines are less useful for detecting disturbance in climate-sensitive vegetation types where the maximum observed NDVI reflects extreme productivity rather than a sense of background normal. For example, during an average year, grasslands may appear disturbed relative to the All-Year Maximum NDVI. To know if an area is experiencing drought stress or an early or late spring or fall, the All-Year Mean for the period is better suited. In many respects, the All-Year Mean is analogous to our everyday understanding of “normals” or “averages” used by meteorologists.
Current NDVI values are calculated in two ways. All but the Early Detect product use the maximum NDVI value of the 24-day moving window. (That is, ForWarn uses the best cloud-free, and greenest observation obtained). While needed to ensure a clean, cloud free value, the approach often makes it difficult to detect disturbances during the growing season until the entire 24 day window has passed. Even with continuous clear skies, a wildfire on day 2 of the 24 day window leaves day 1 green values that will provide the maximum NDVI for the period. As this is the pre-fire condition, detection is delayed.
To achieve a more near-real-time emphasis on recency, Early Detect uses an adaptive length window so that disturbances might be captured after one day or in a similar length of time as needed by the standard baseline within the 24 day period if clouds persist. This approach is not without its shortcomings, as recent observations can provide marginal NDVI due to somewhat poor atmospheric quality or thin clouds. Acceptance of these NDVI values can cause apparent anomalies that are not vegetation.
There are a total of six different forest change products available every eight days that highlight potential forest disturbances, which are under the Forest NDVI Change category. The different forest change products relate to the length of the baseline and the compositing method used to display percent NDVI departure. They are:
- Change using a 1-Year Baseline (recent disturbances, 1yr or less);
- Early Detect 1-Year Baseline (disturbance resolved in as few as 8-days);
- Change using a 3-Year Baseline (3-year old disturbances);
- Change using a 5-Year Baseline (5-year old disturbances);
- Change using a 10-Year Baseline (10-year old disturbances);
- Change using an All-Year Baseline (all disturbances since 2000);
- Seasonal Progression Departure (by Hargrove);
- The following (2) are located under the "Theme = Seasonal Summaries" drop-down:
- - Prominent disturbance "Duration" (produced at two periods during the summer growing season);
- - Prominent disturbance "Magnitude" (produced once at the end of the summer growing season);
All change products, except the 'Early Detect', are based on a composited mosaic using maximum NDVI value over a 24-day period. The Early Detect uses an 8-day compositing window, because of the limited number of days from which to acquire the maximum NDVI value, these change images may contain more 'nose' associated with clouds, anomalous artifacts and more apparent NDVI decline.
*** SEE PRODUCT DESCRIPTIONS AND BEST USE ***
http://tiny.cc/bvxnuz
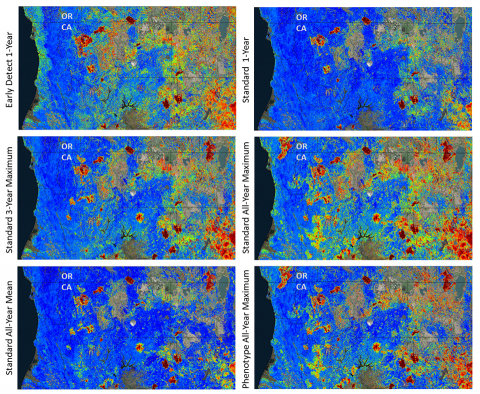 Figure 2: Baselines tell different stories, particularly in landscapes with a lot of change. In northeastern California for Sep. 21, 2014, the Early Detect product shows larger burn areas in the fire just southeast of the “CA” than the Standard 1 year baseline, but it also shows more decline in the dryer eastern half of the image and along the foggy coast. Progressing from the 1-Year to the 3-Year the All-Year shows the cumulative decline from past fire events in addition to the 2014 drought impacts on sensitive vegetation in the east. This drought effect is lessened in the All-Year Mean, as it provides more average baseline values rather than the year of greatest productivity and that helps separate disturbances from climate impacts. Average long-term values make it hard to make sense of cumulative fire effects involving disturbance or recovery. The phenotype maximum baseline mutes the extreme values of the All-Year Maximum.
