Hurricane Michael storms Florida's panhandle


More information about this event
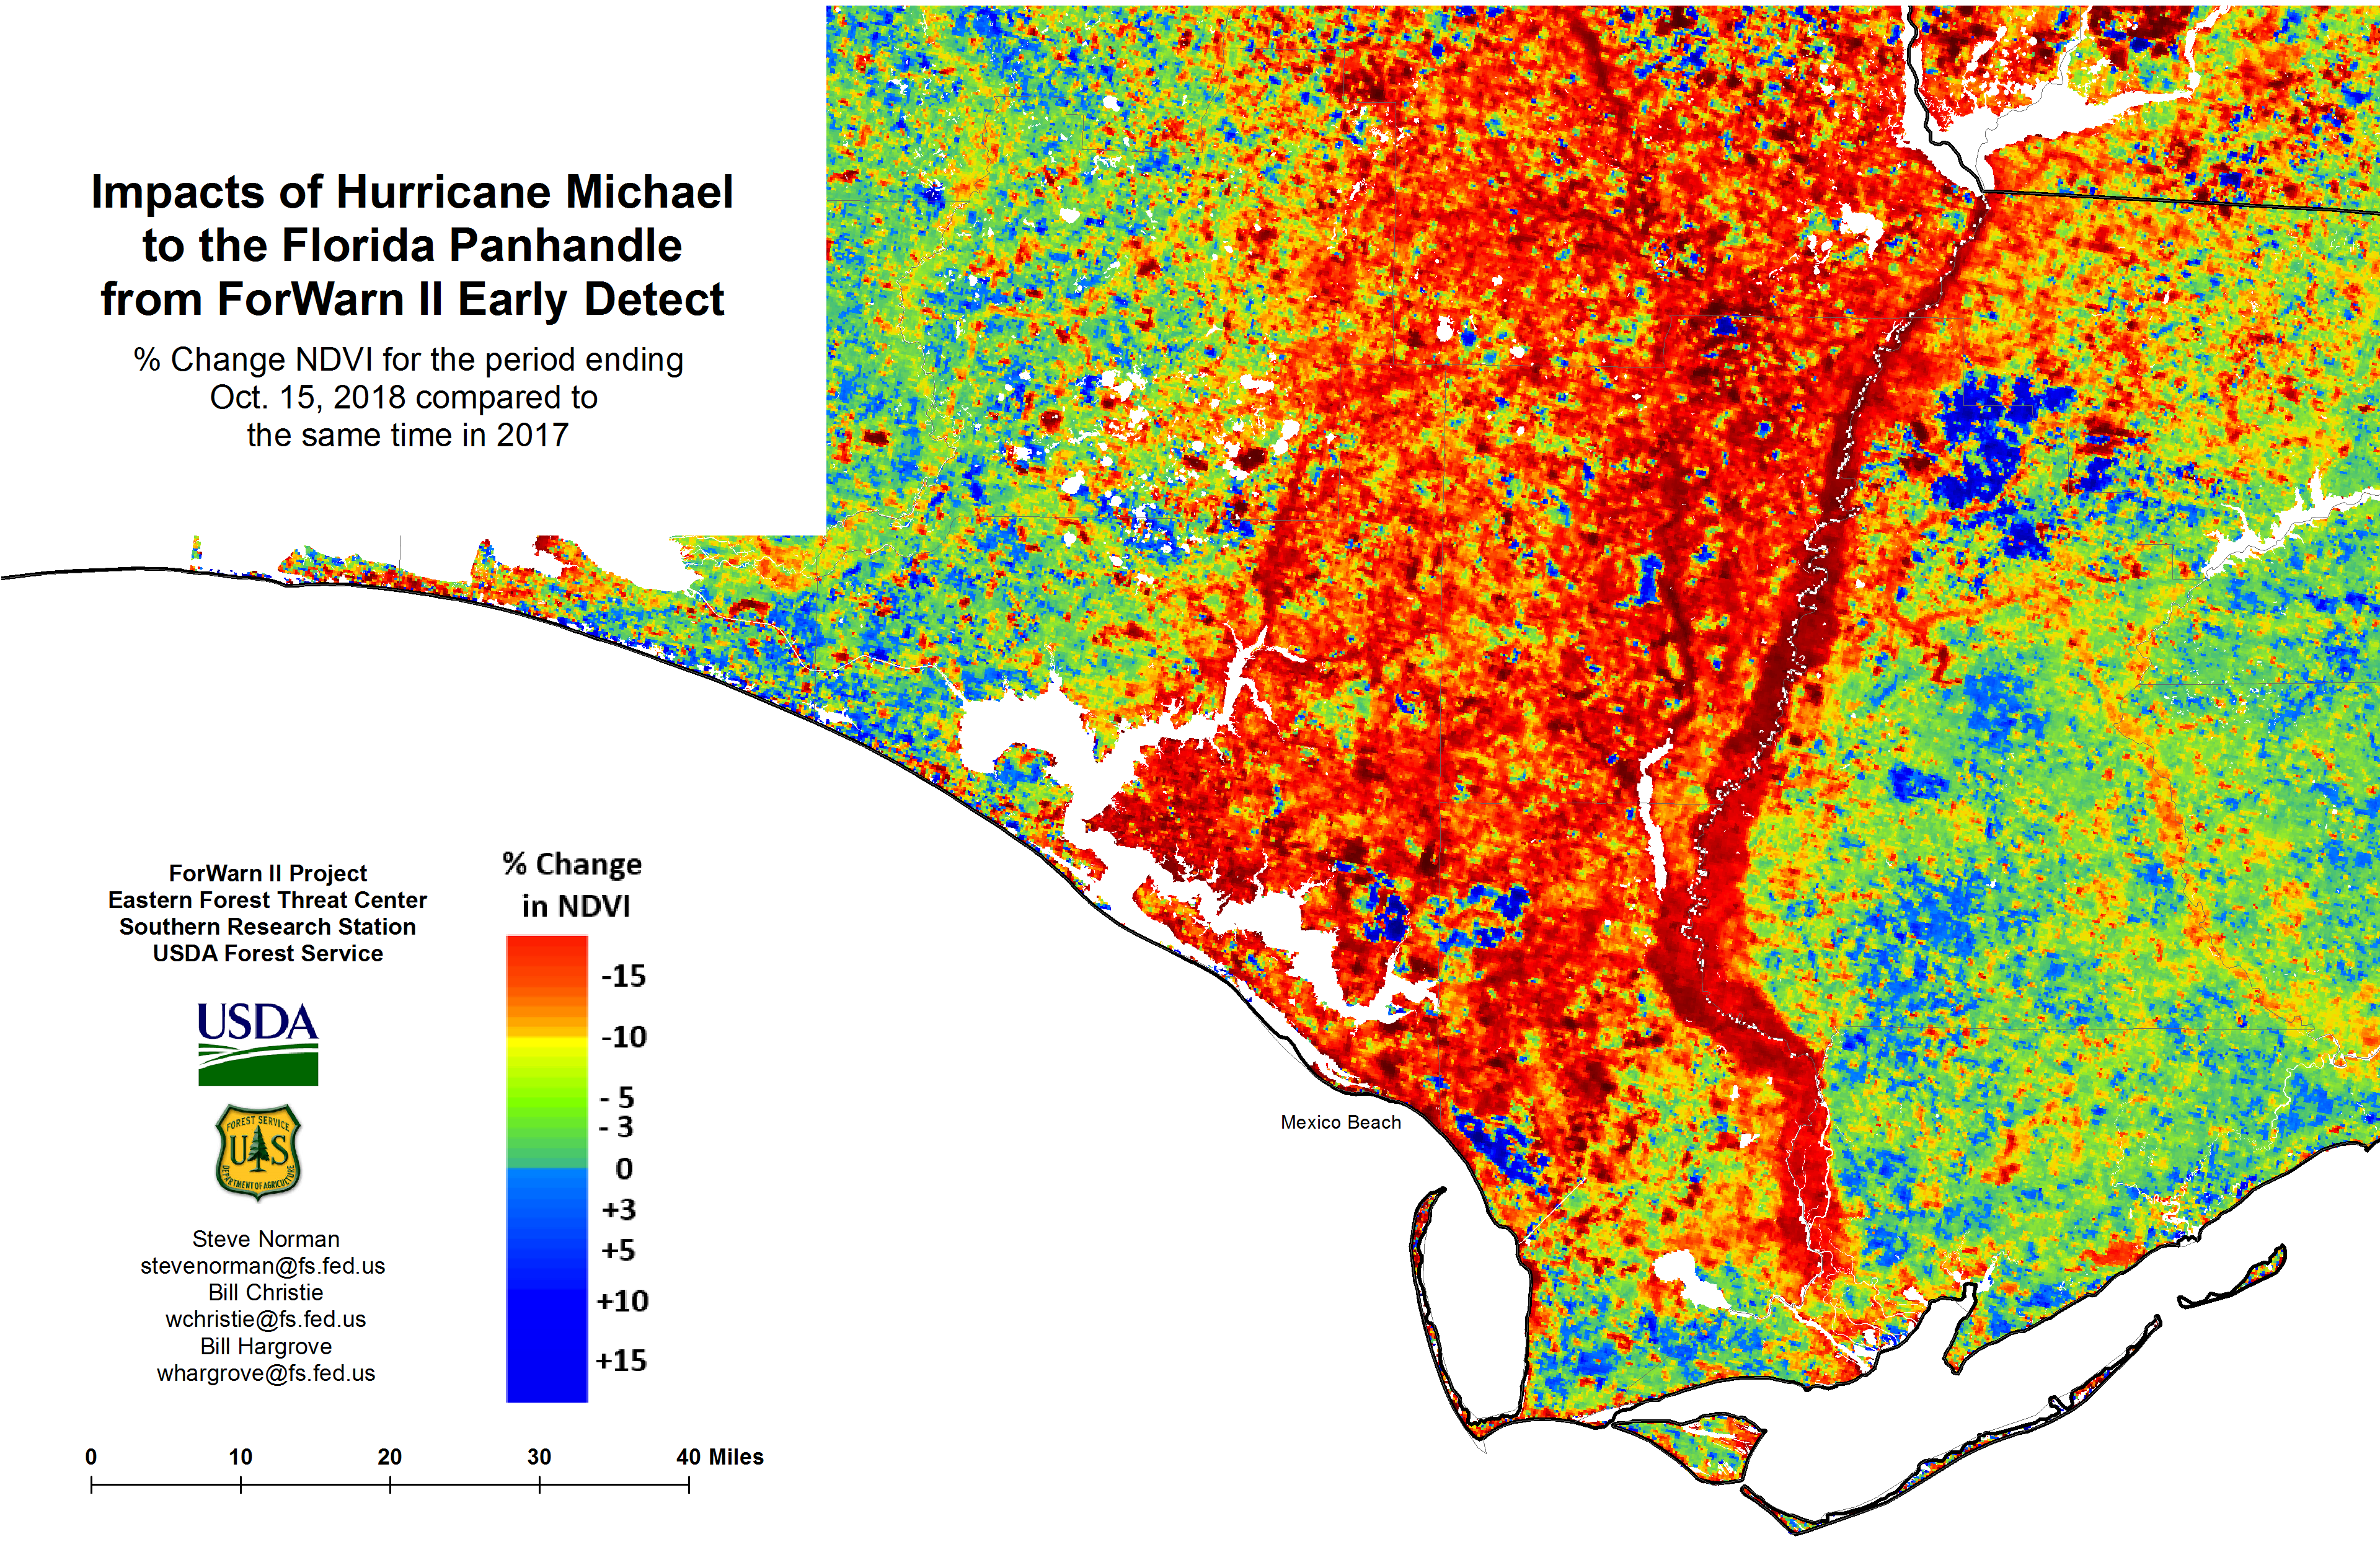
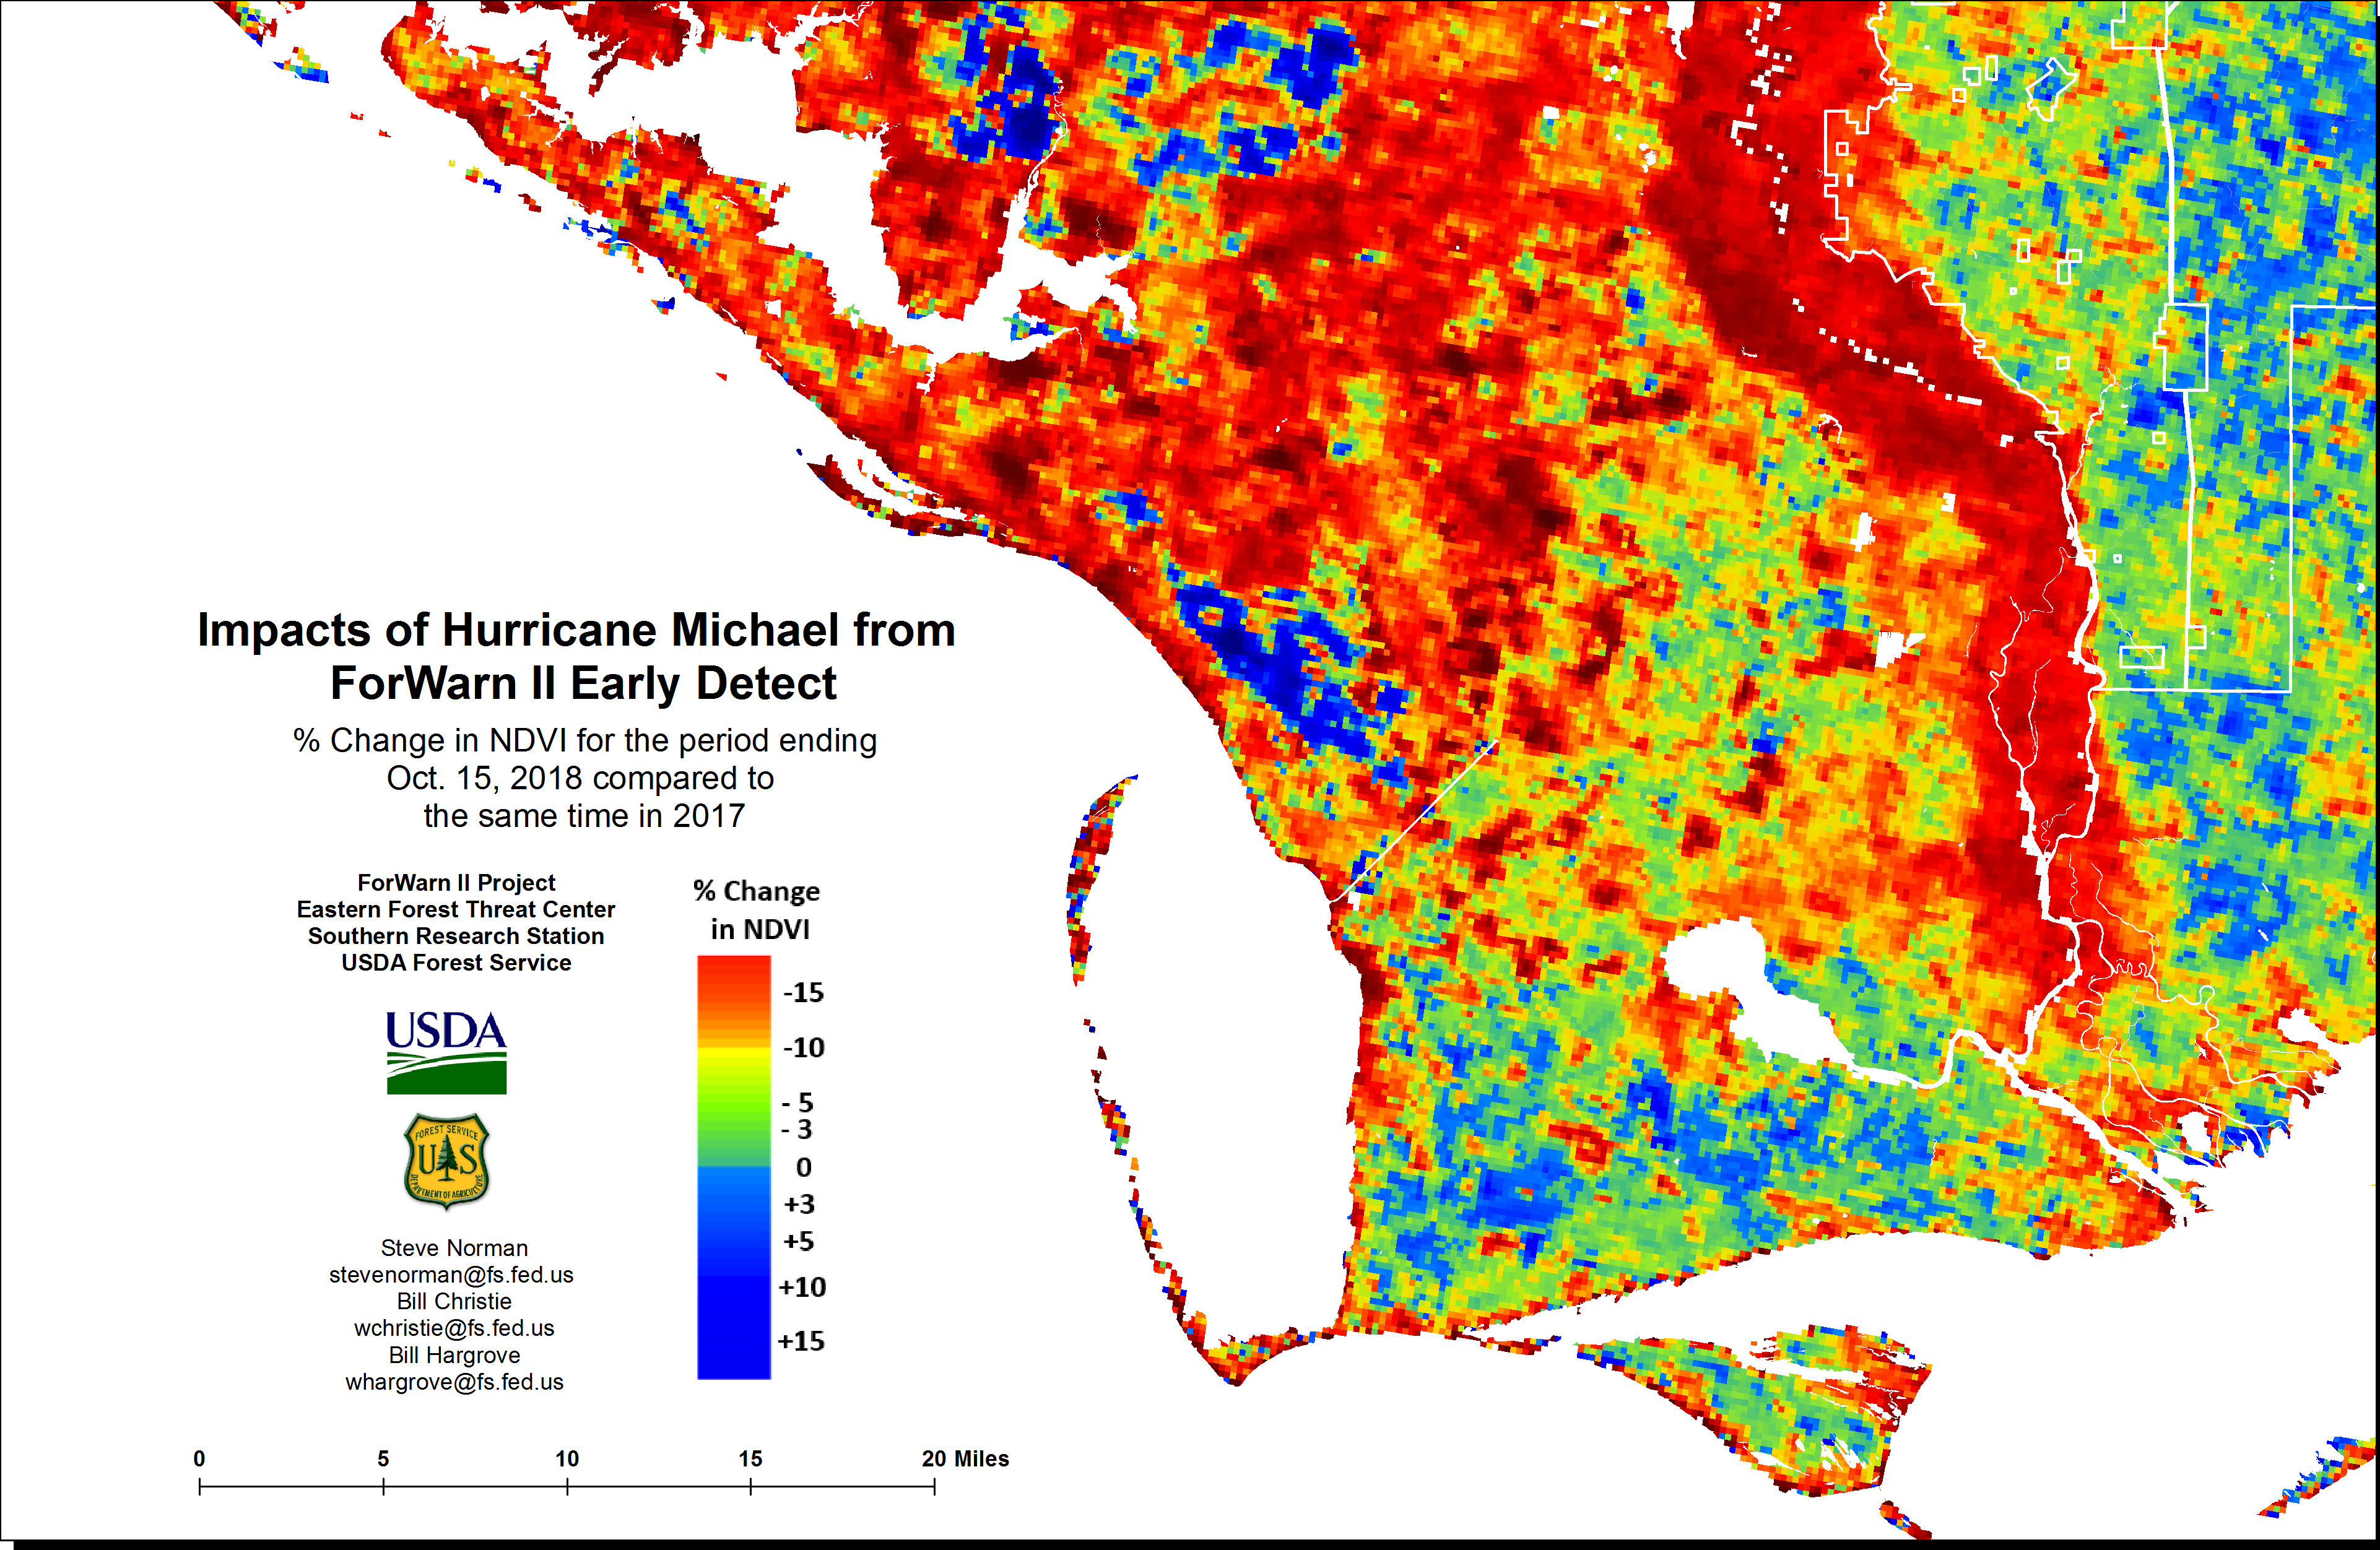
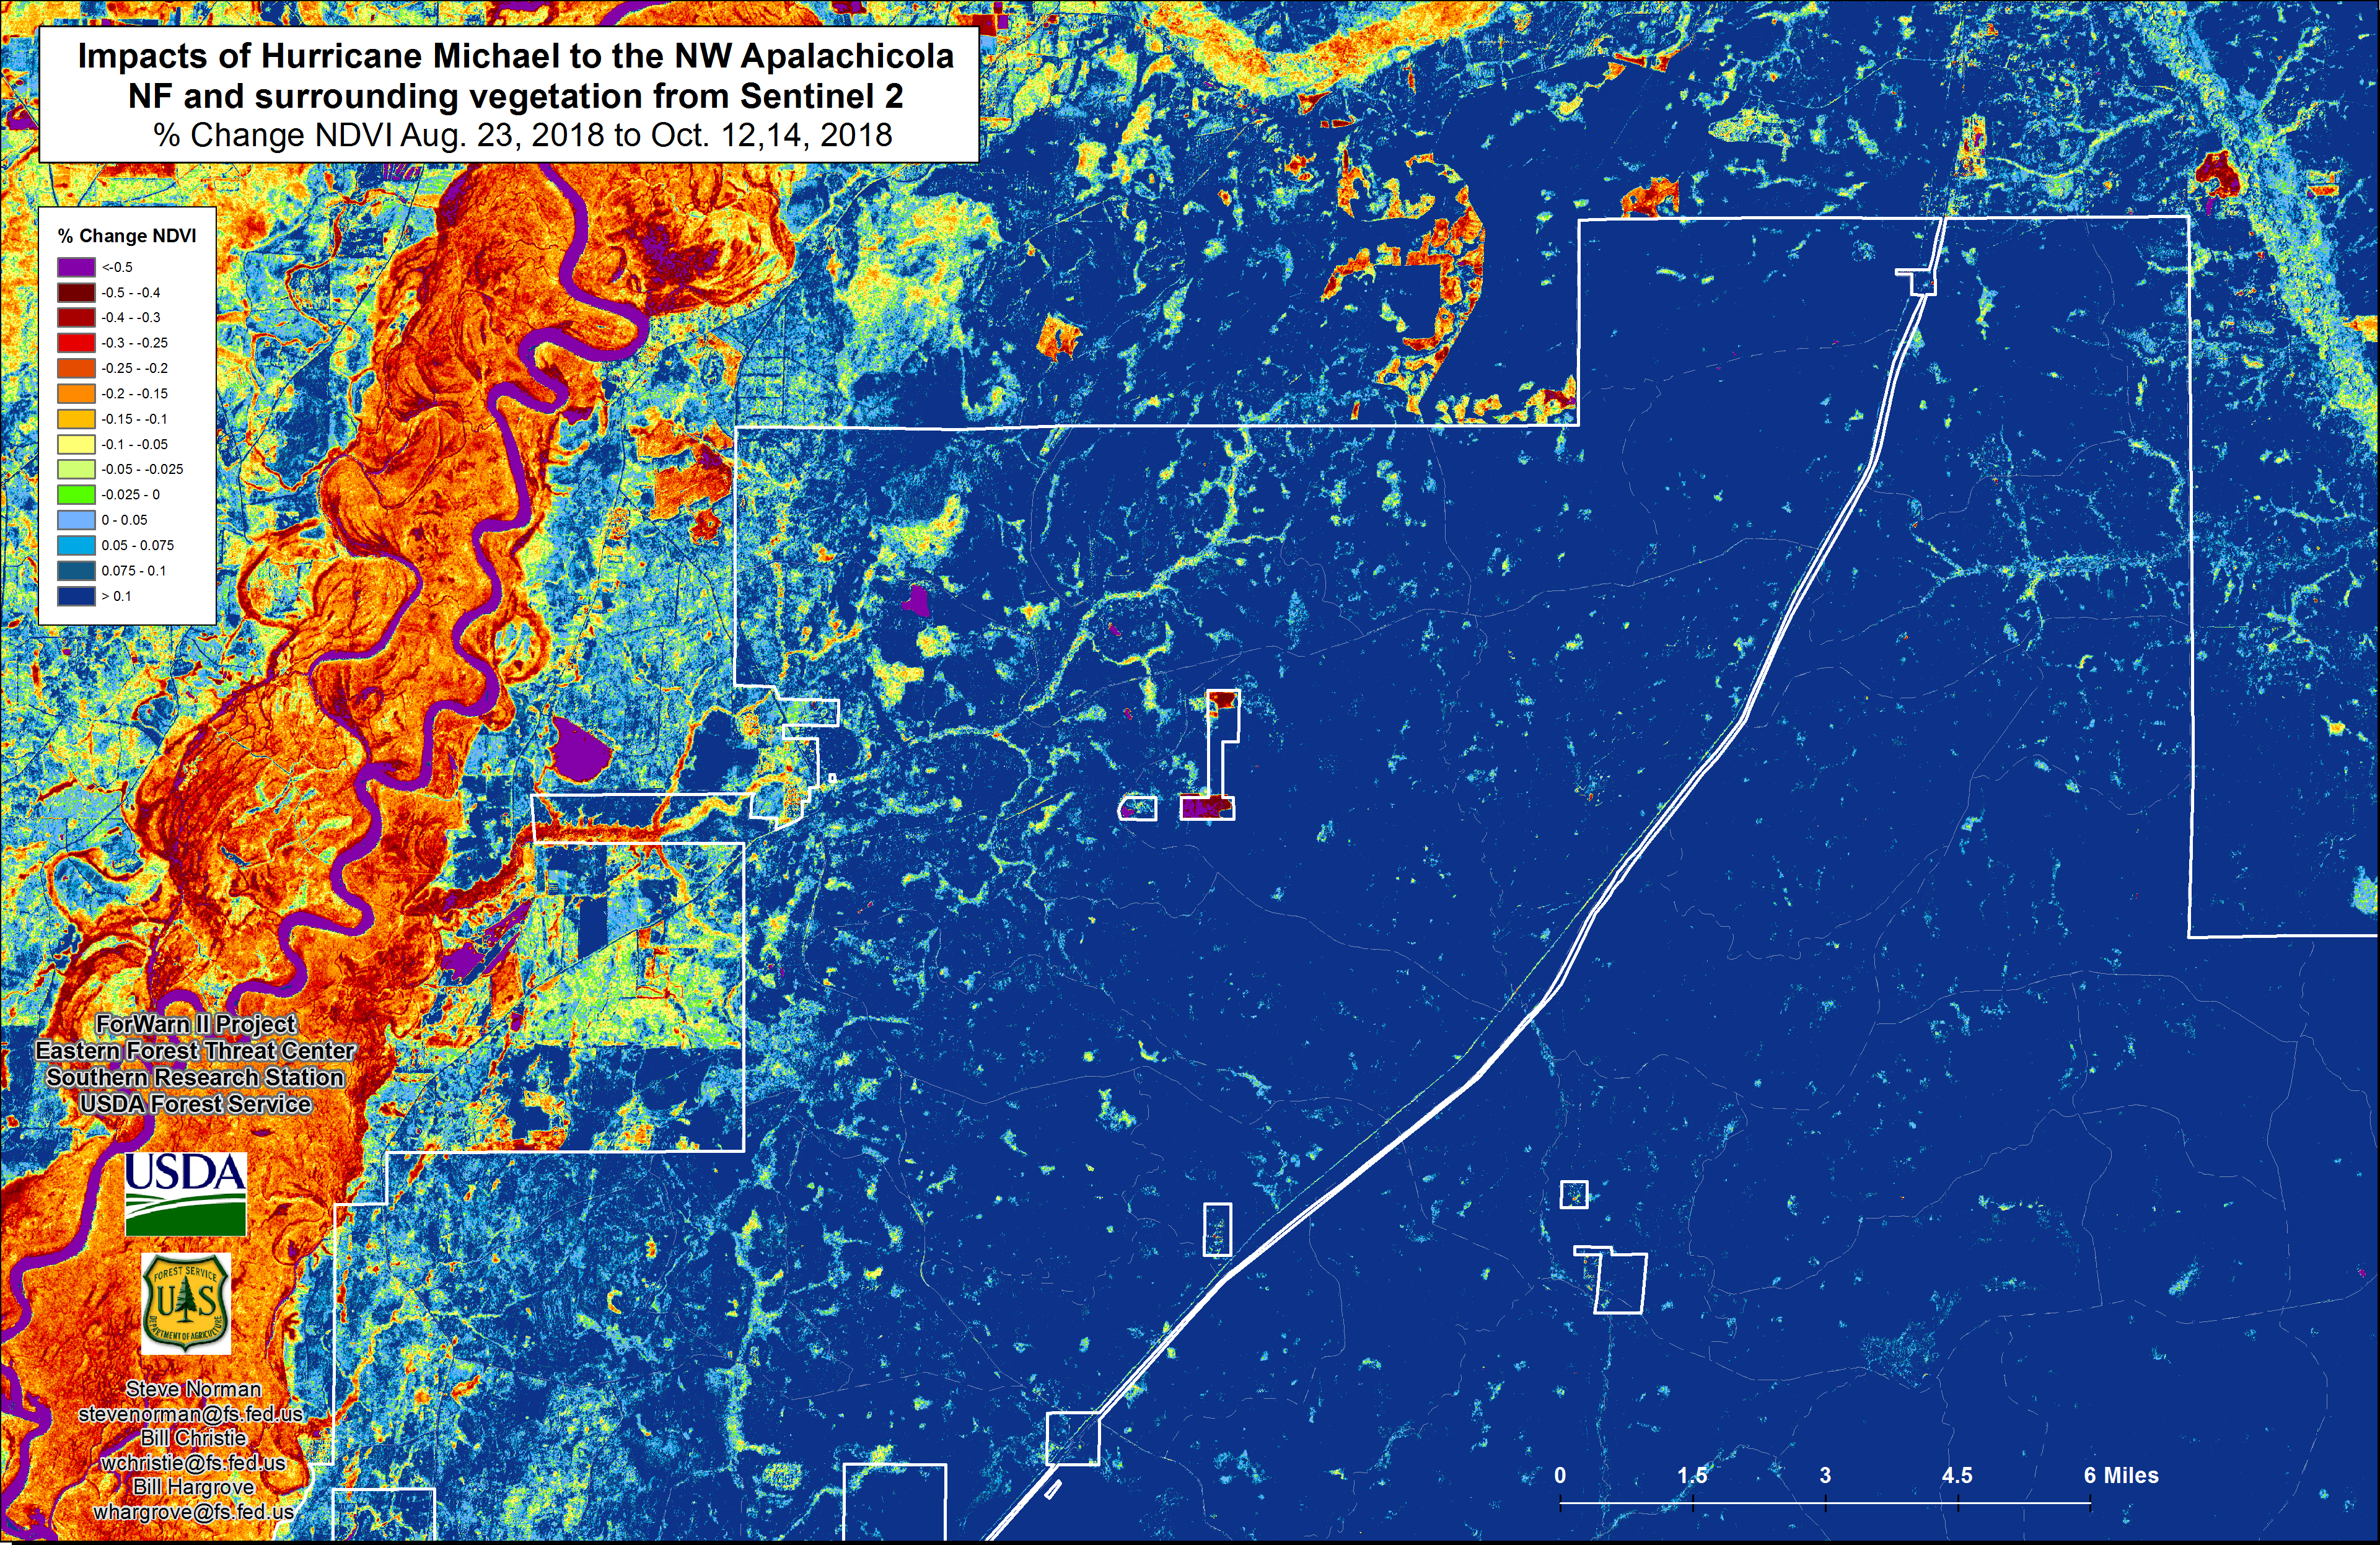
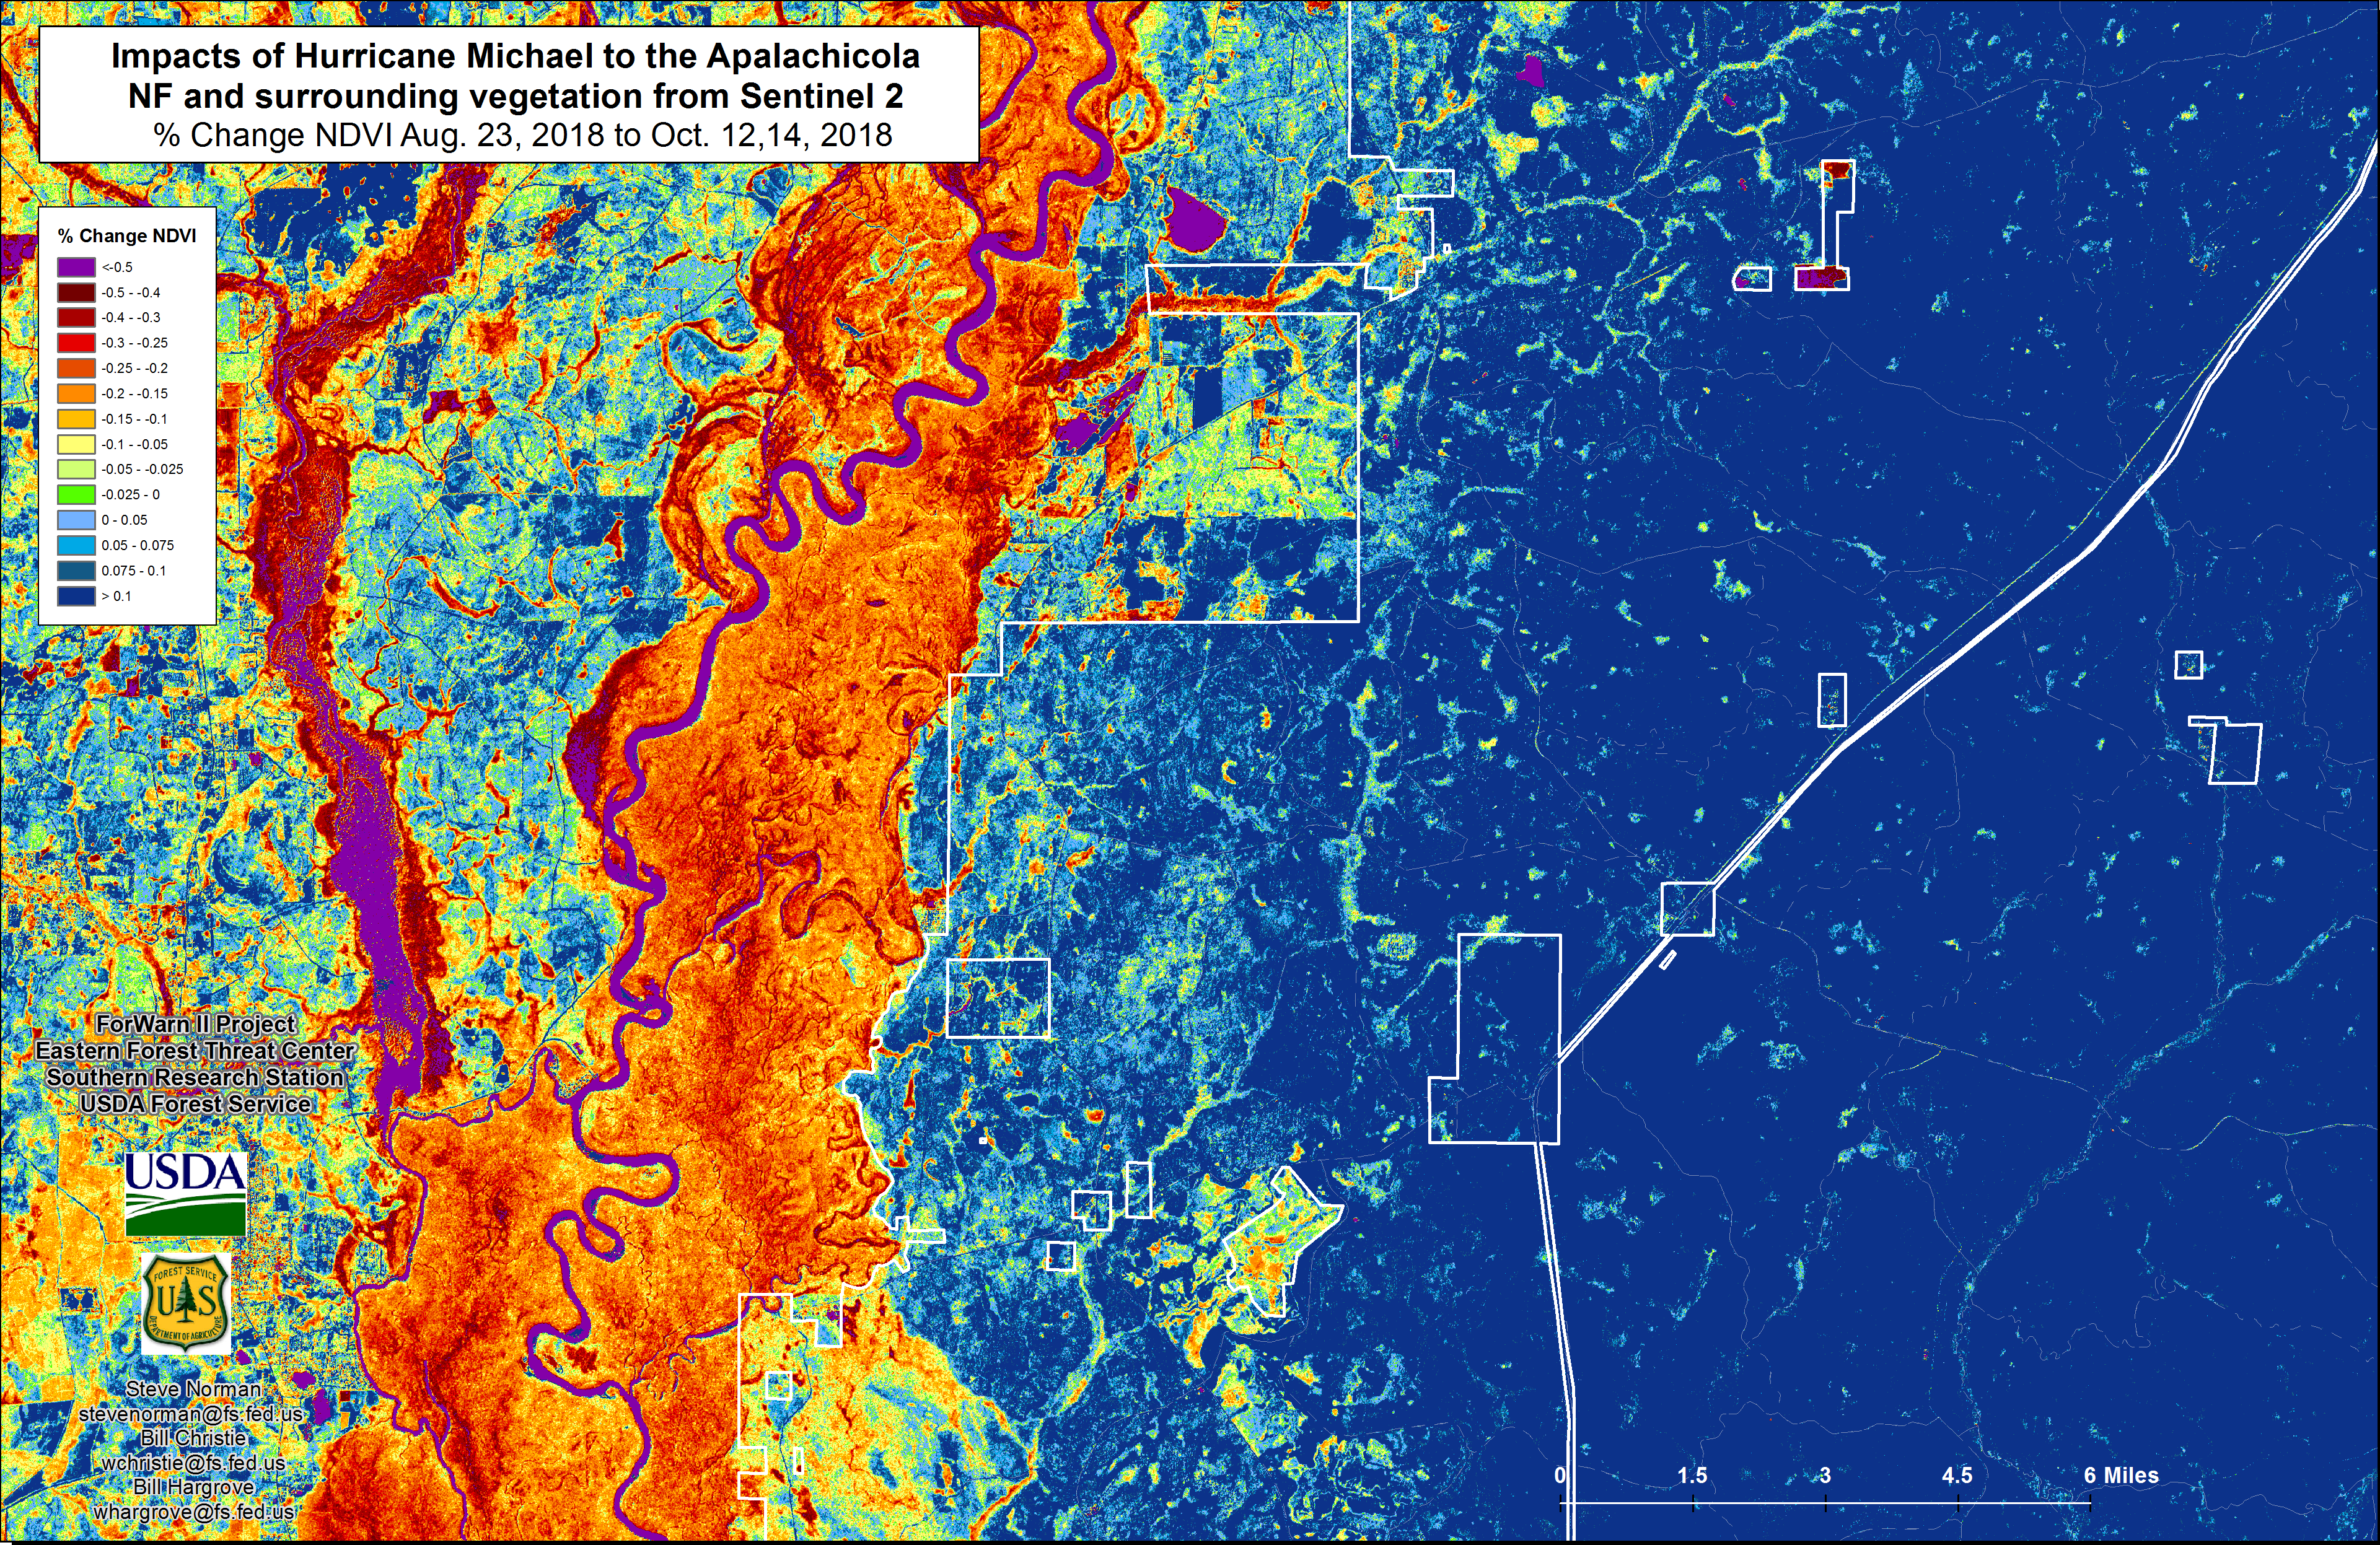
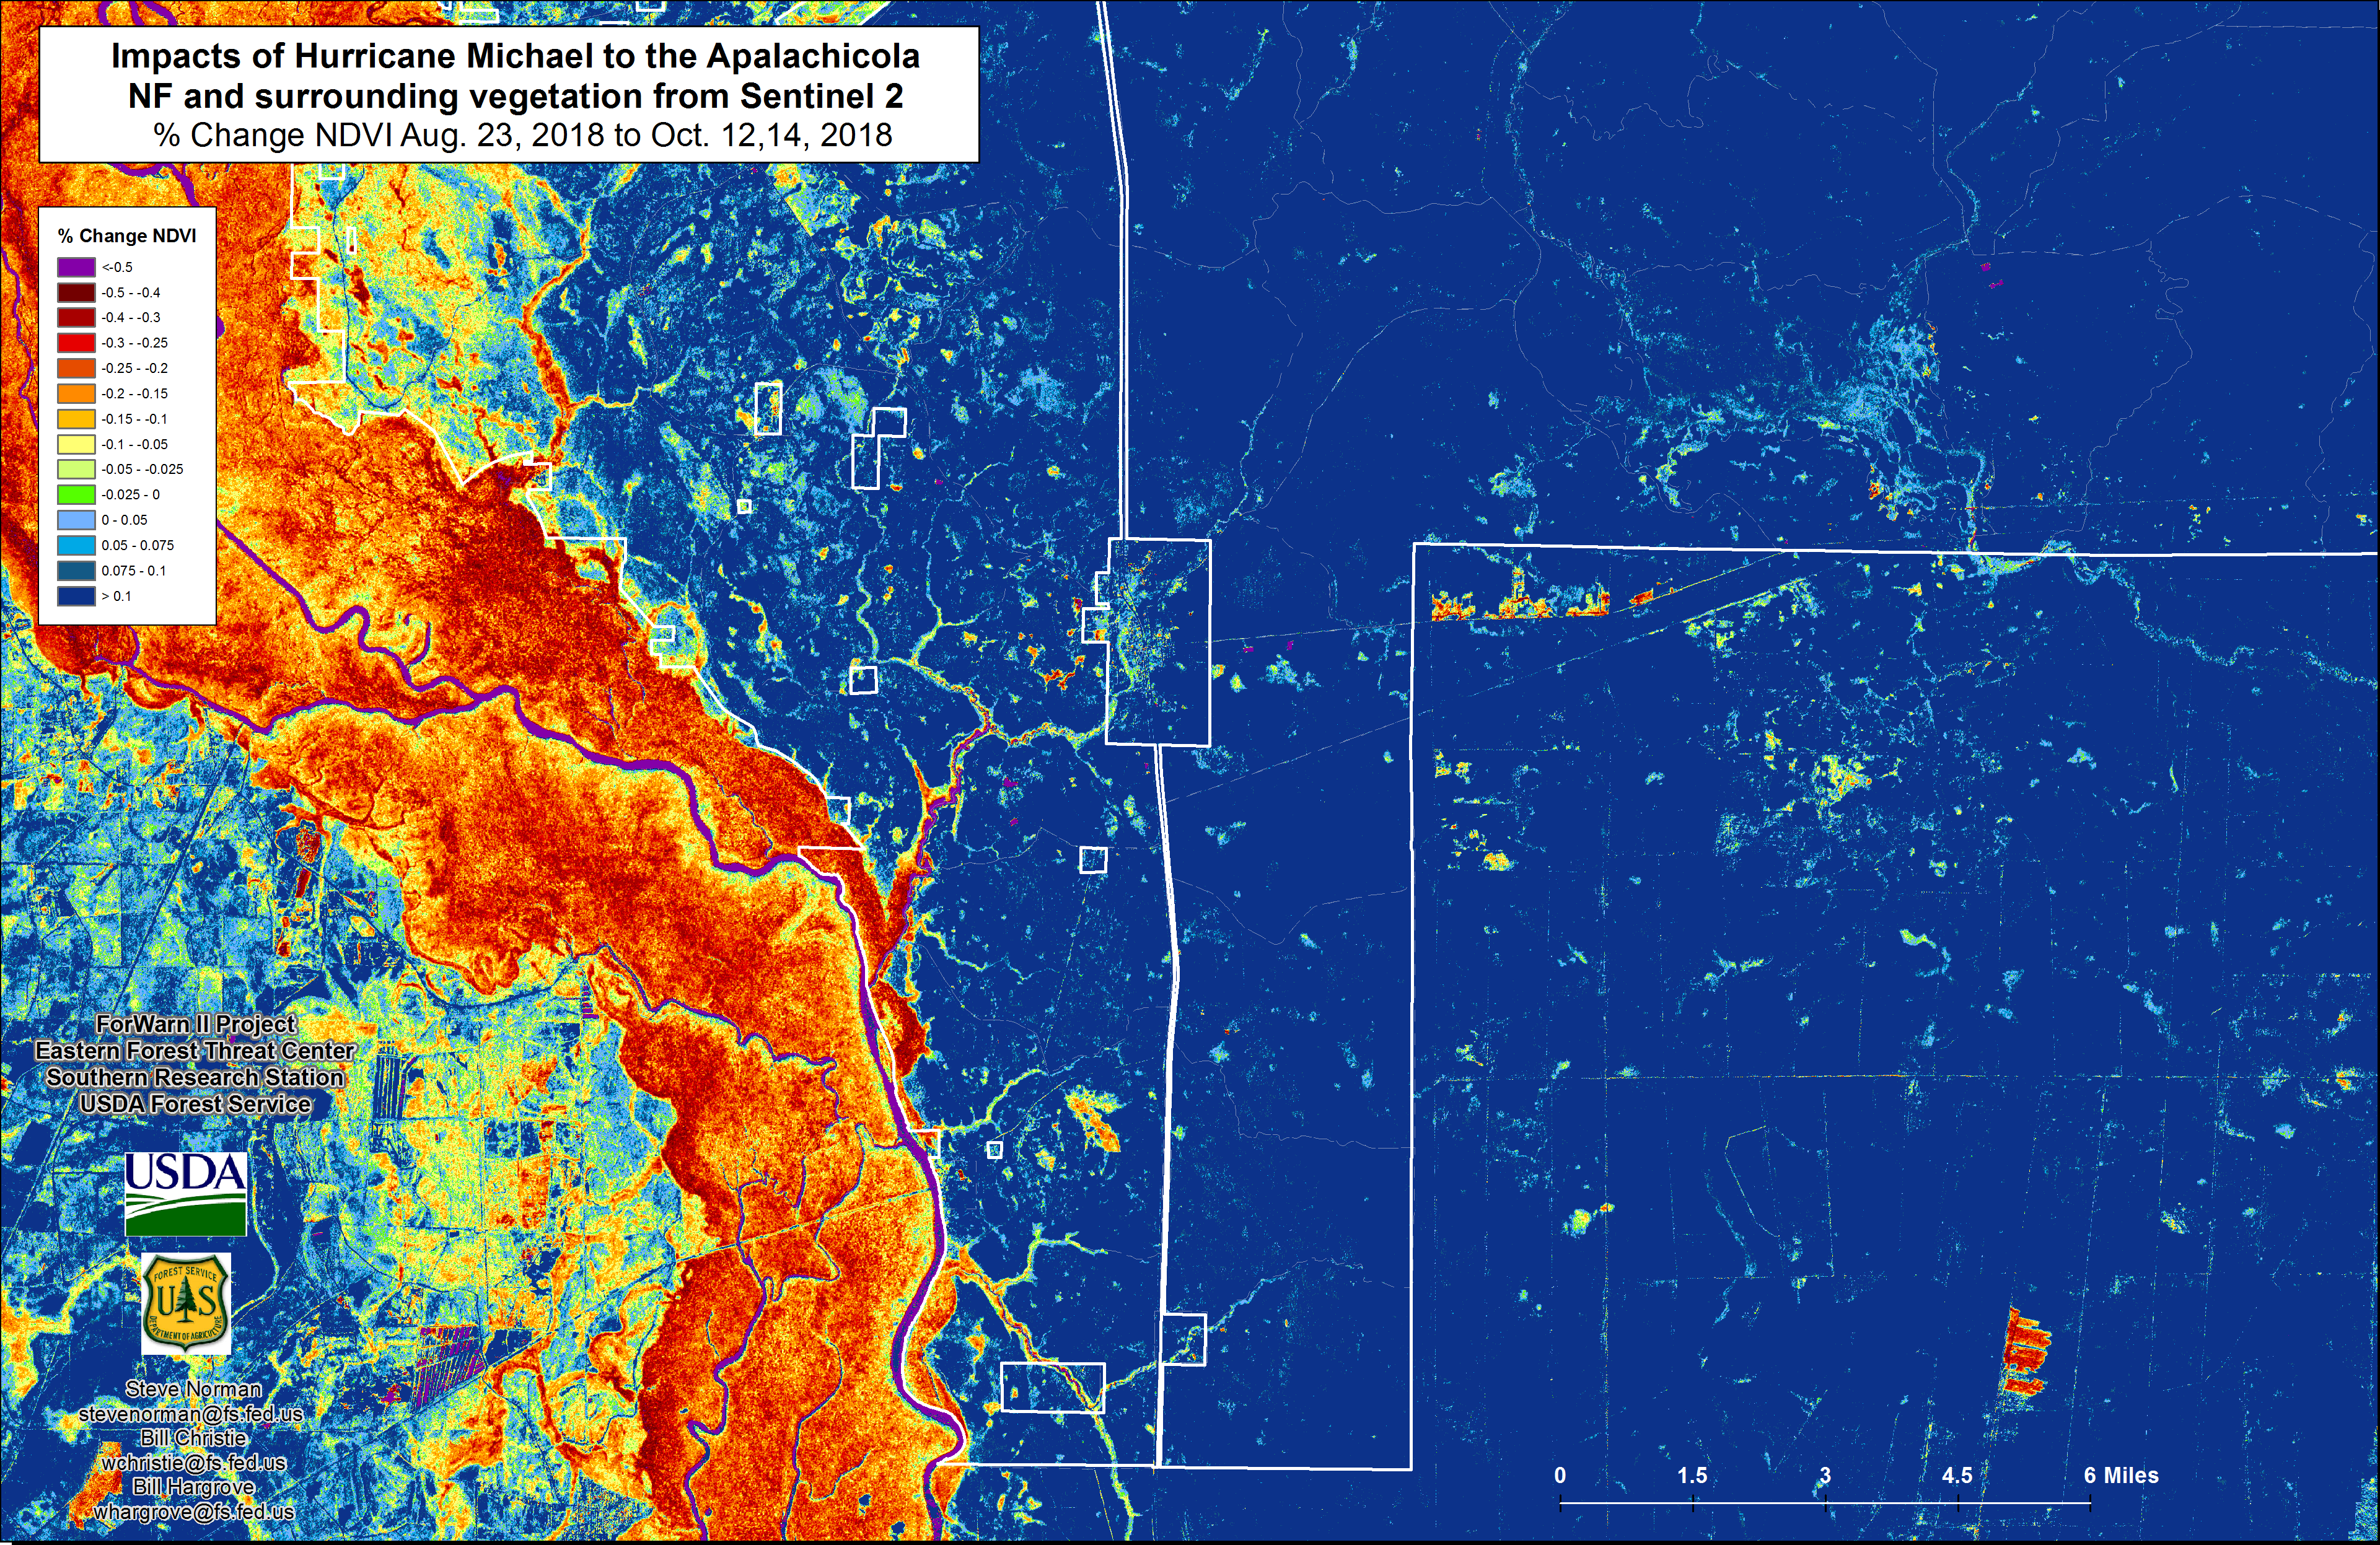
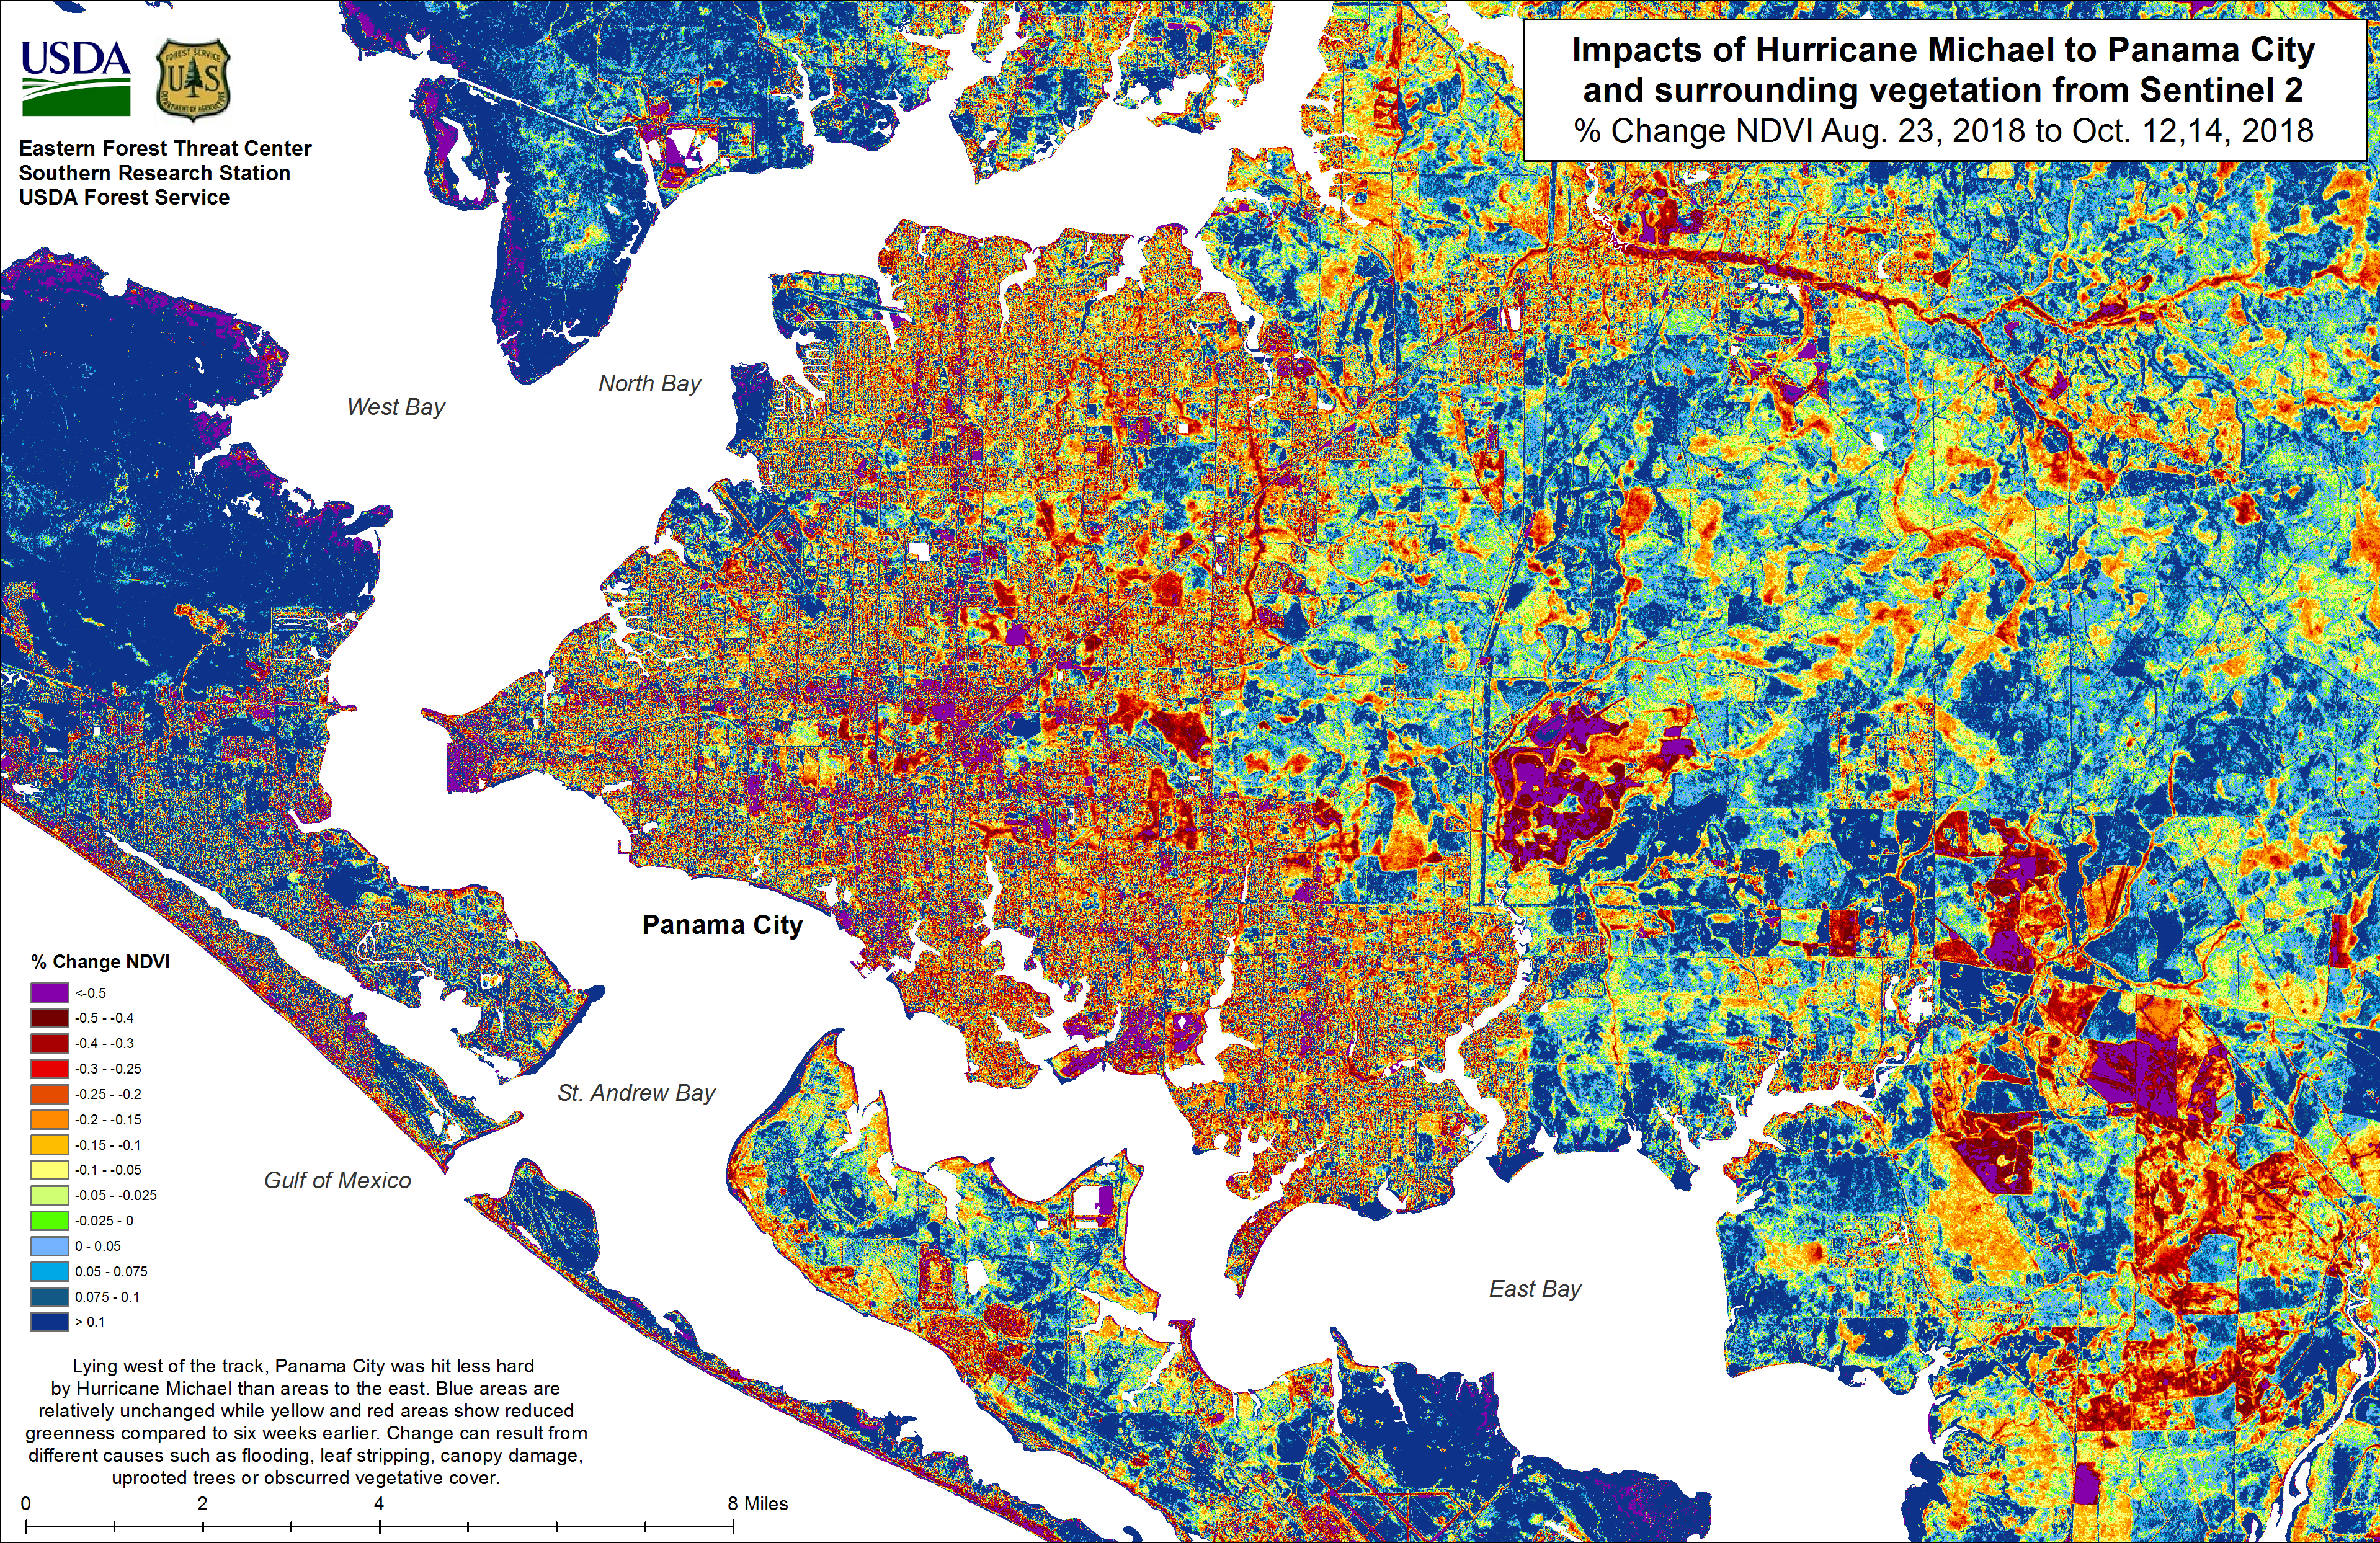
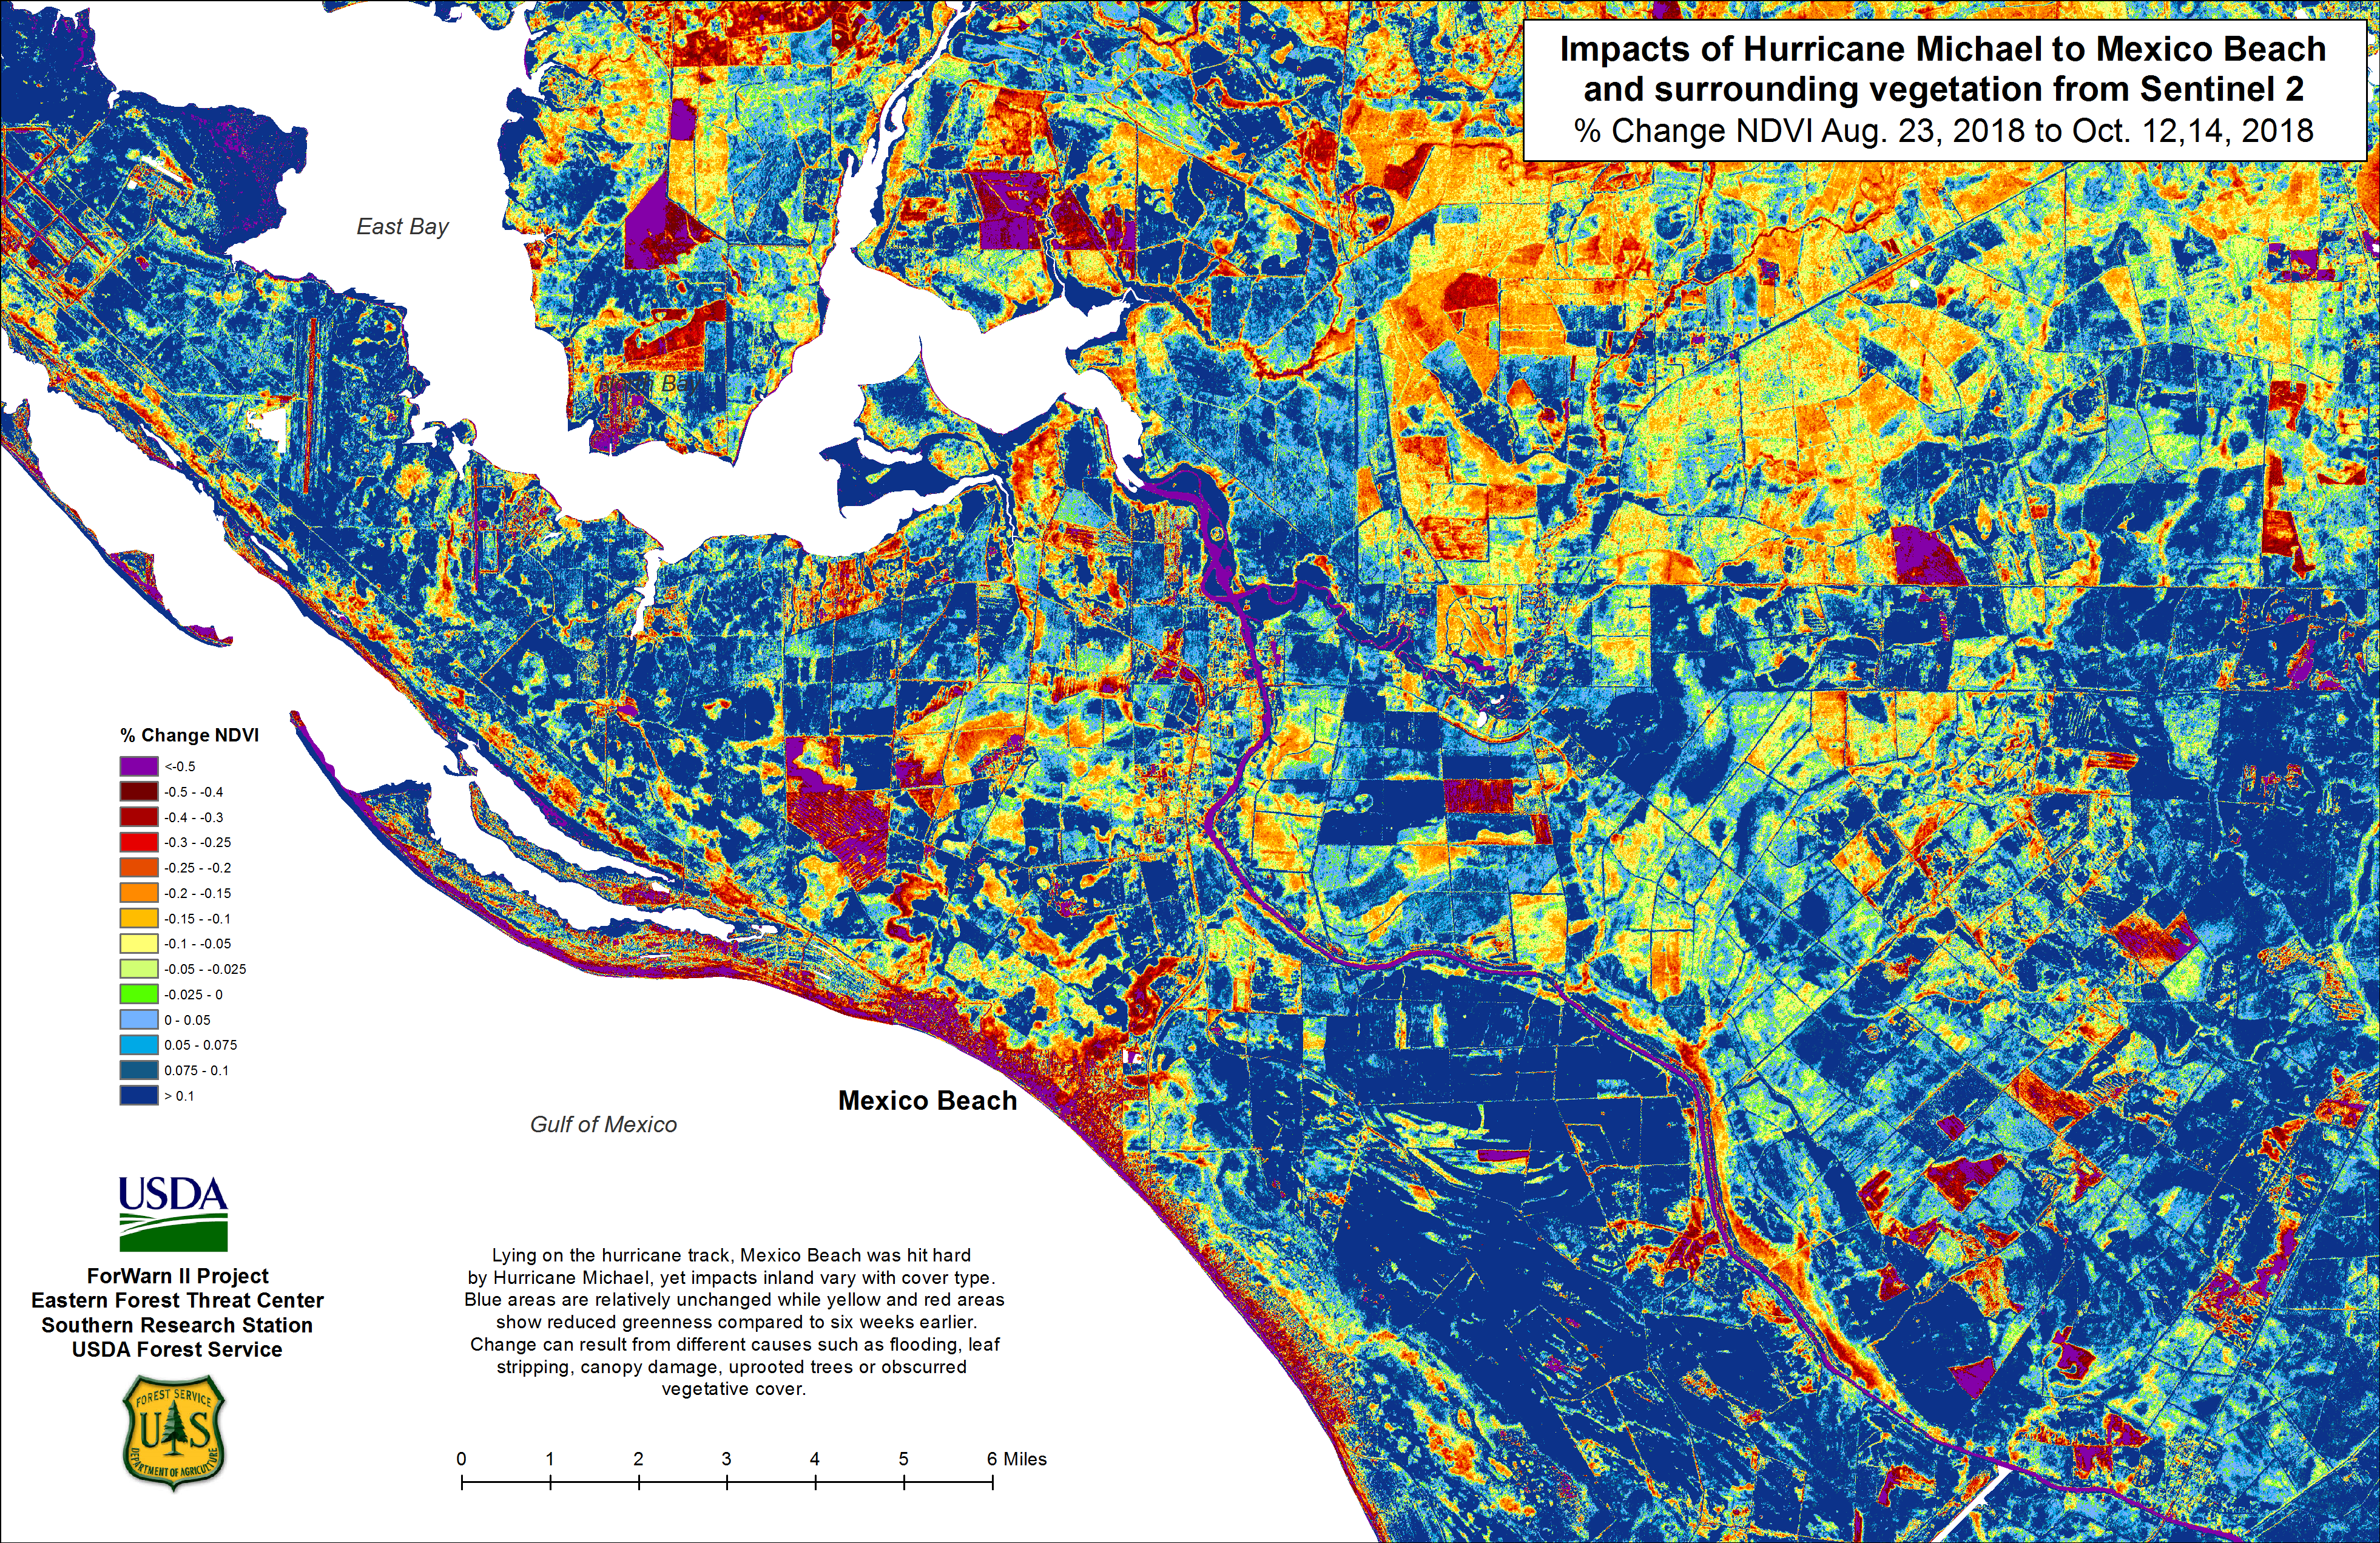
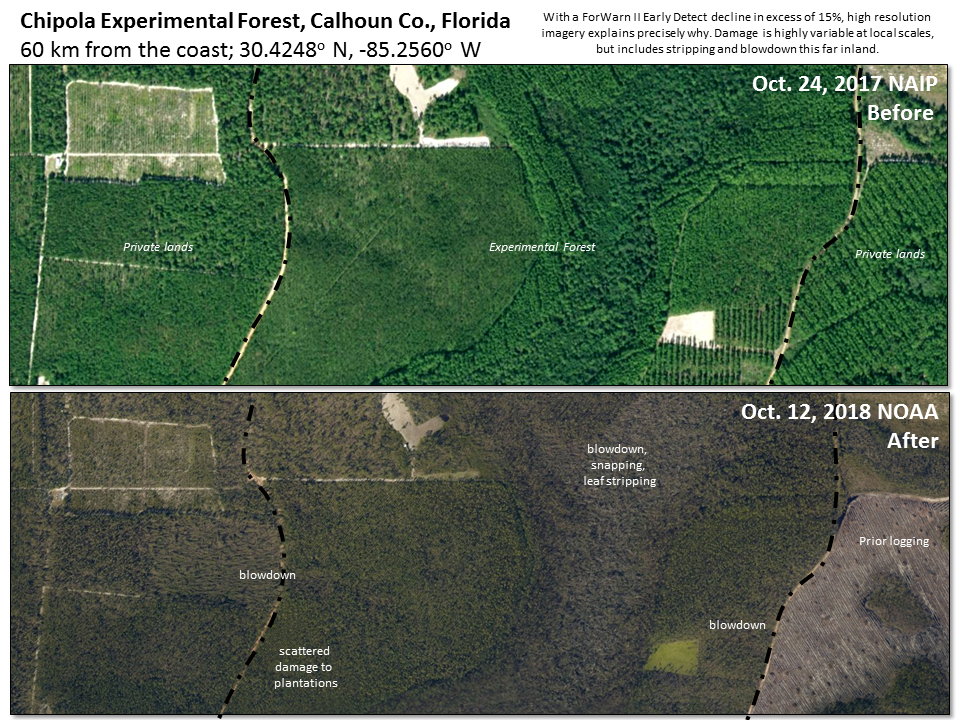
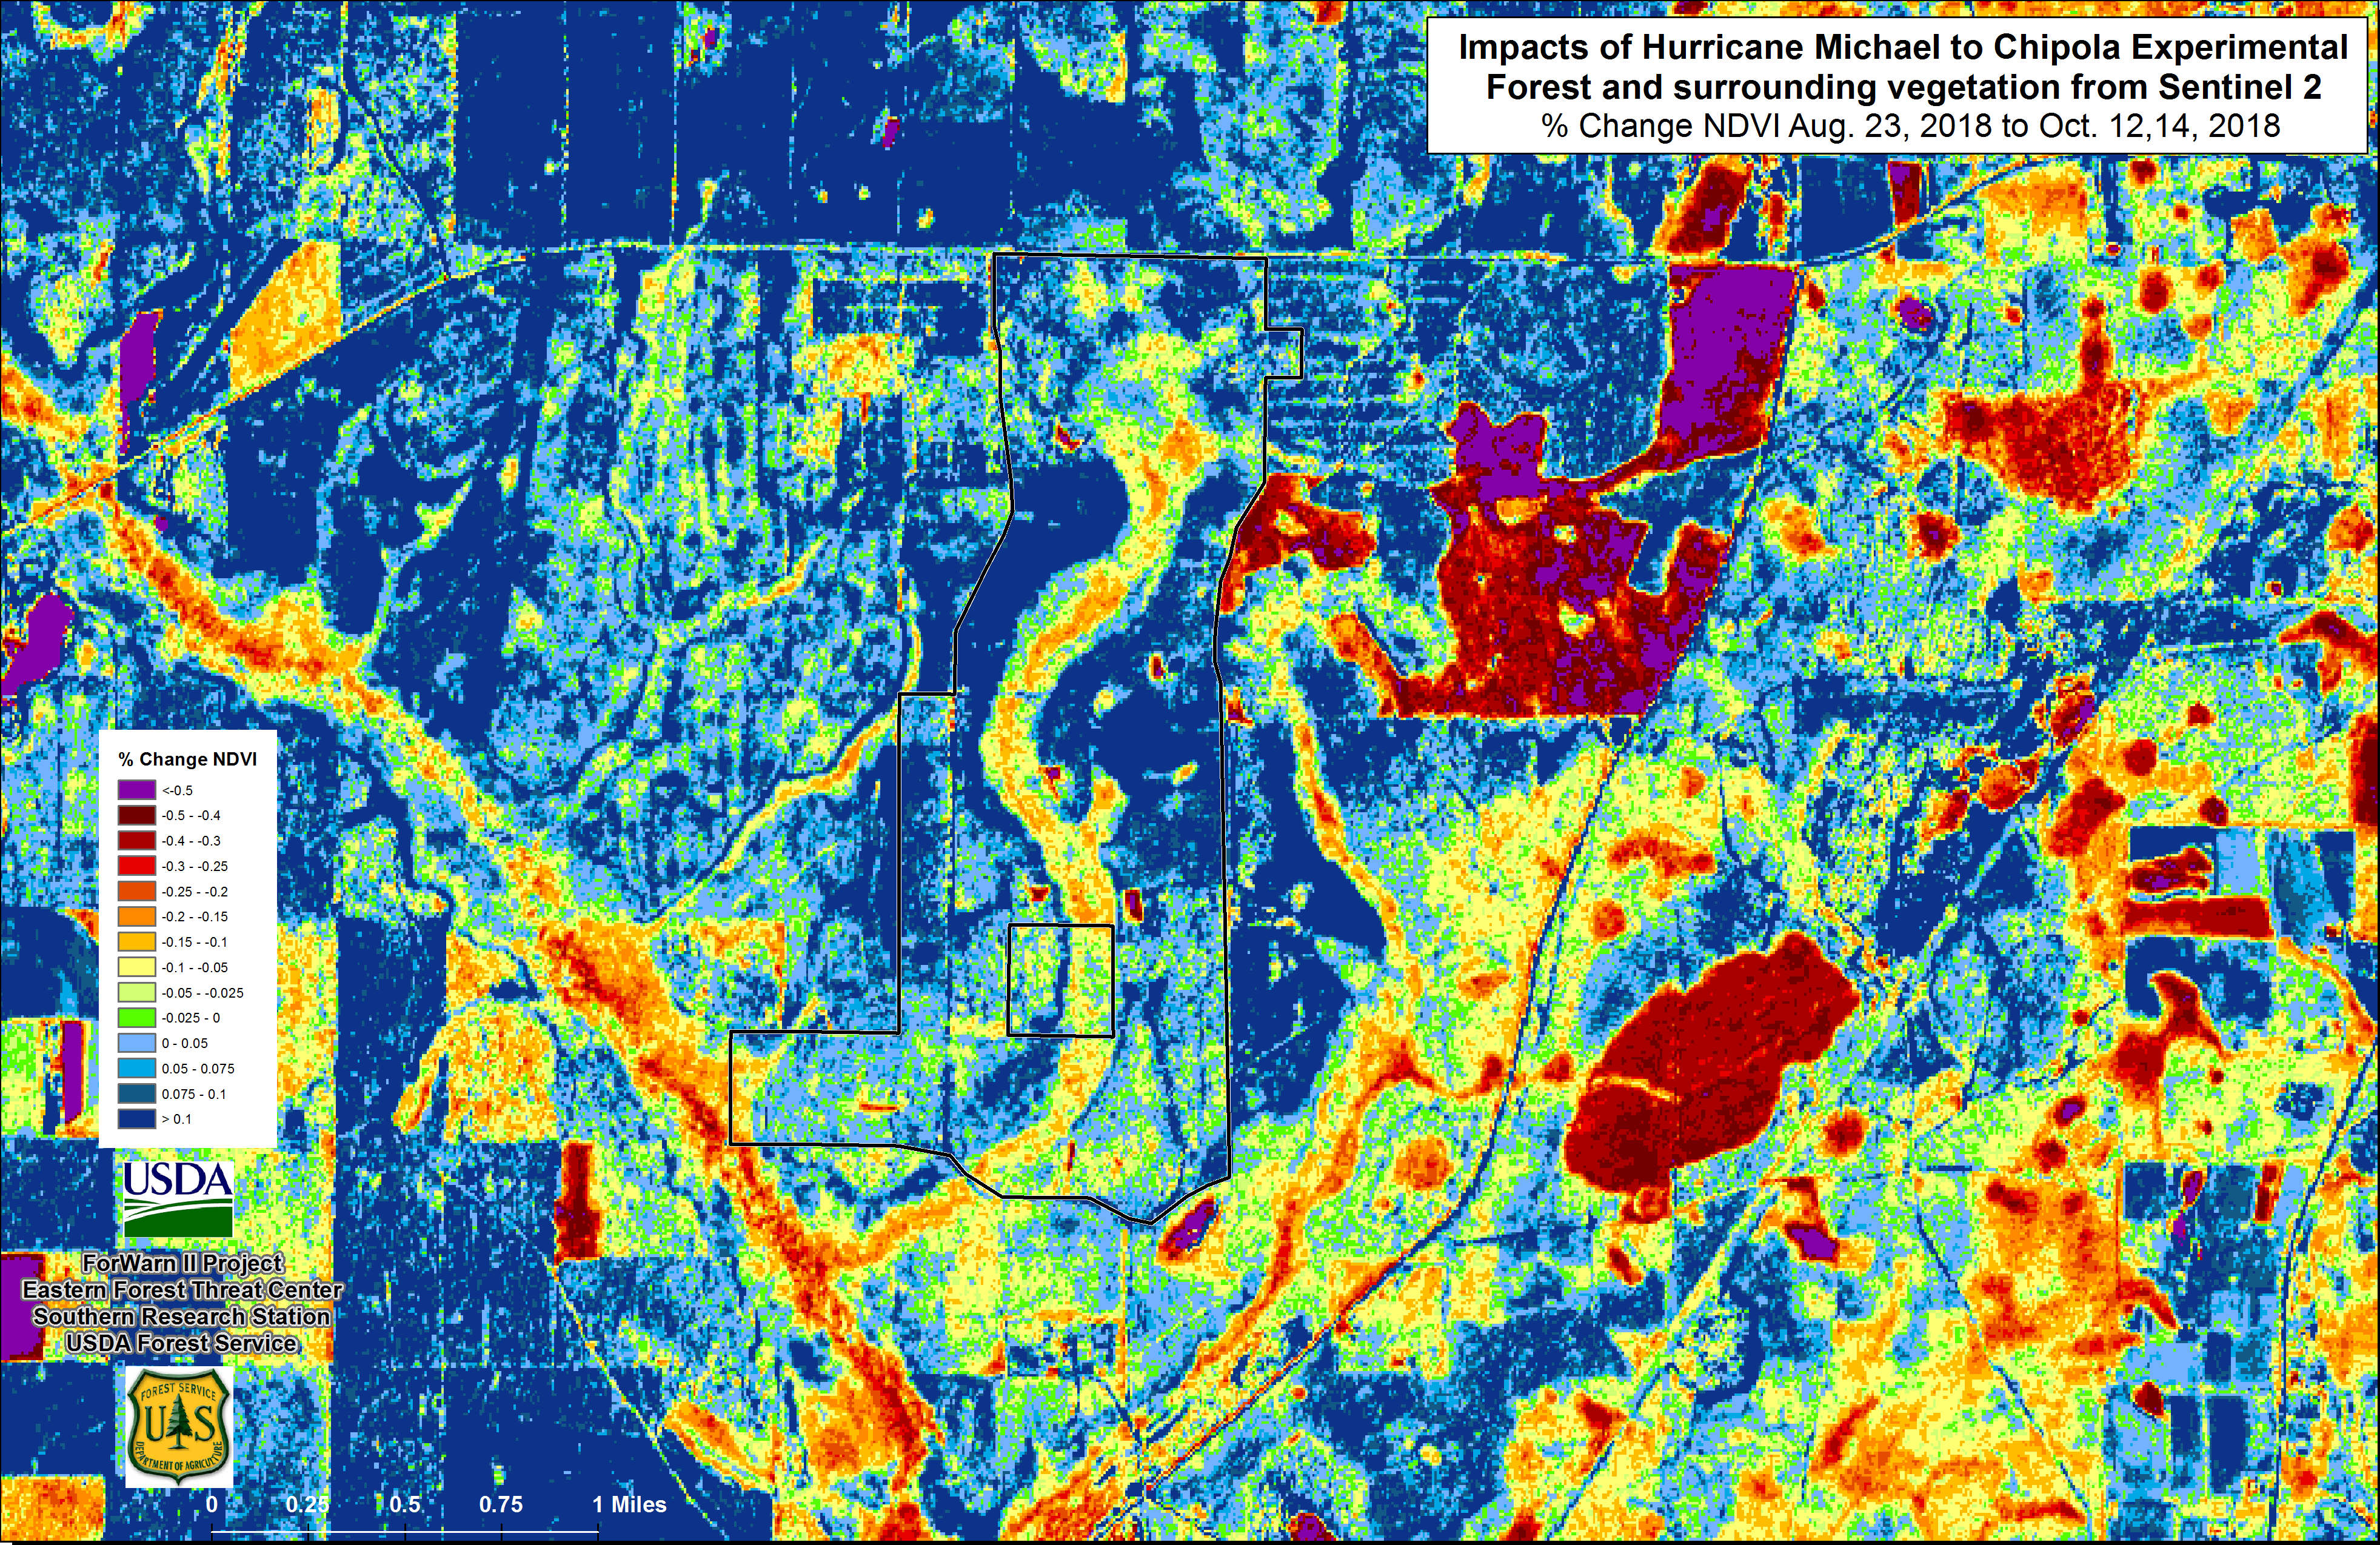
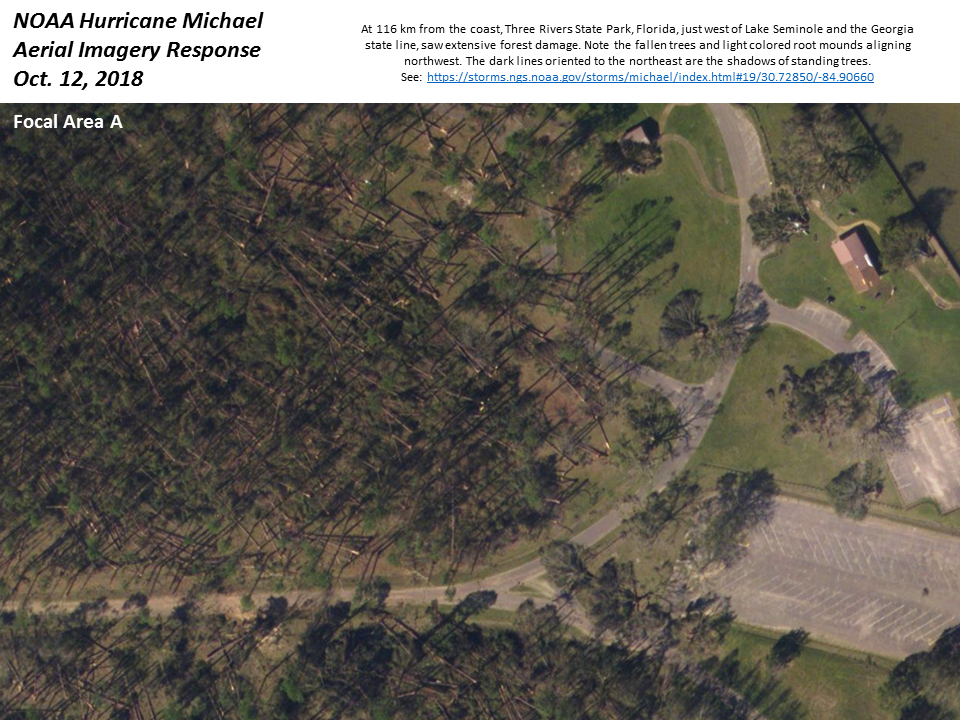
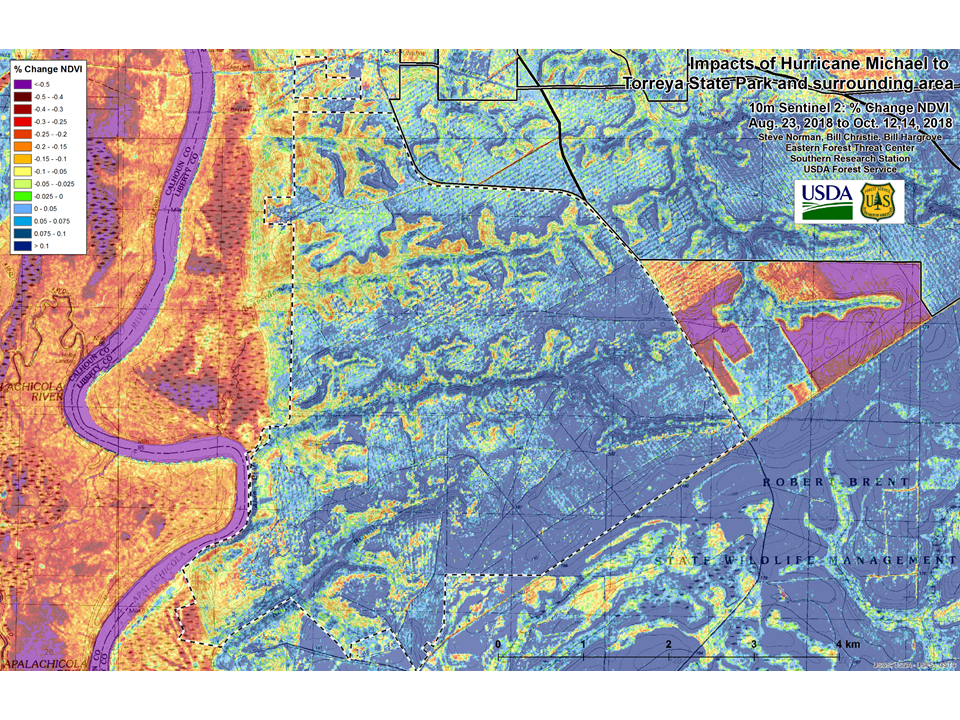
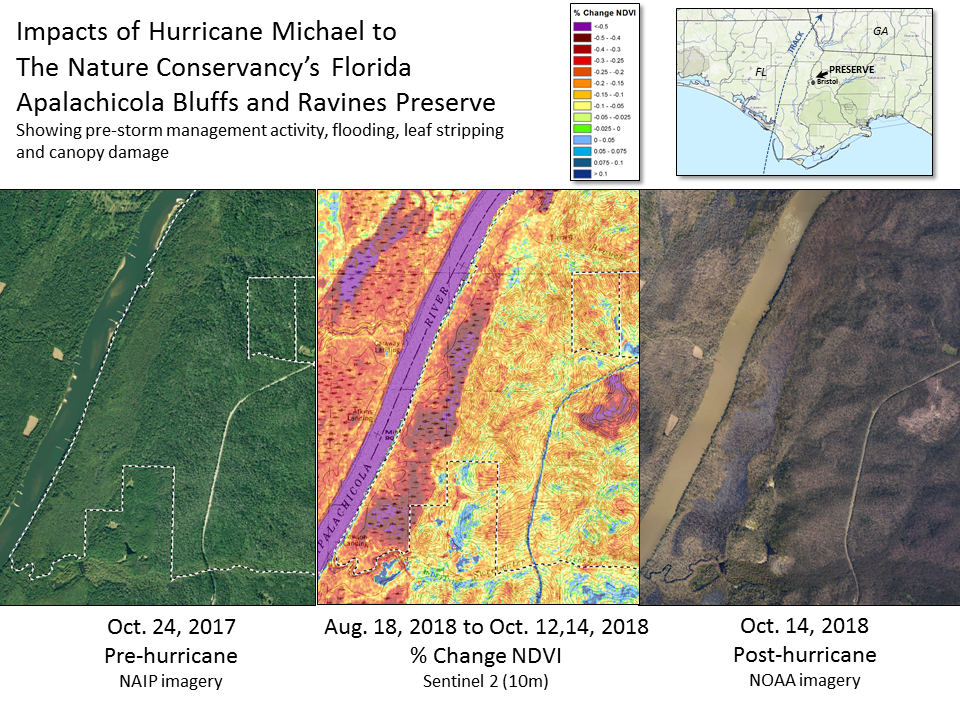
The destructive impacts of Category 4 Hurricane Michael on the forests of northwest Florida were captured by ForWarn II's routinely produced Early Detect product one week after the event. The stark pattern of greatest damage in red and orange consists of a 50 km-wide swath that stretches from near the track of the hurricane's eye to the Apalachicola River which likely had reduced greenness from both wind damage and flooding. This damage to forests crosses the entire Florida panhandle into Georgia, though the increased area in cultivation in Georgia obscure the power of the storm there compared to Florida. This inland reach of damage is remarkable because wind speeds can rapidly fall with distance inland.
The Early Detect product uses a 1 year baseline, which is an important consideration because of the active forest management that goes on here that includes extensive prescribed fire and logging. Clearcut logging between this image date and the baseline date of a year ago will sharply reduce NDVI, but these patches are local in scale and are readily isolated in ForWarn II's viewer by comparing local conditions in periods immediately prior to the storm. In addition, the most recent Sentinel 2 views that ForWarn II shows can be useful for making local assessments in addition to very high resolution imagery collected for the emergency response. Some areas show up in blue as having an increase in NDVI and those areas usually result from rapid greening of earlier clearcuts. There may be damage to these areas, but it is obscured by the rapid greening of the plantation.
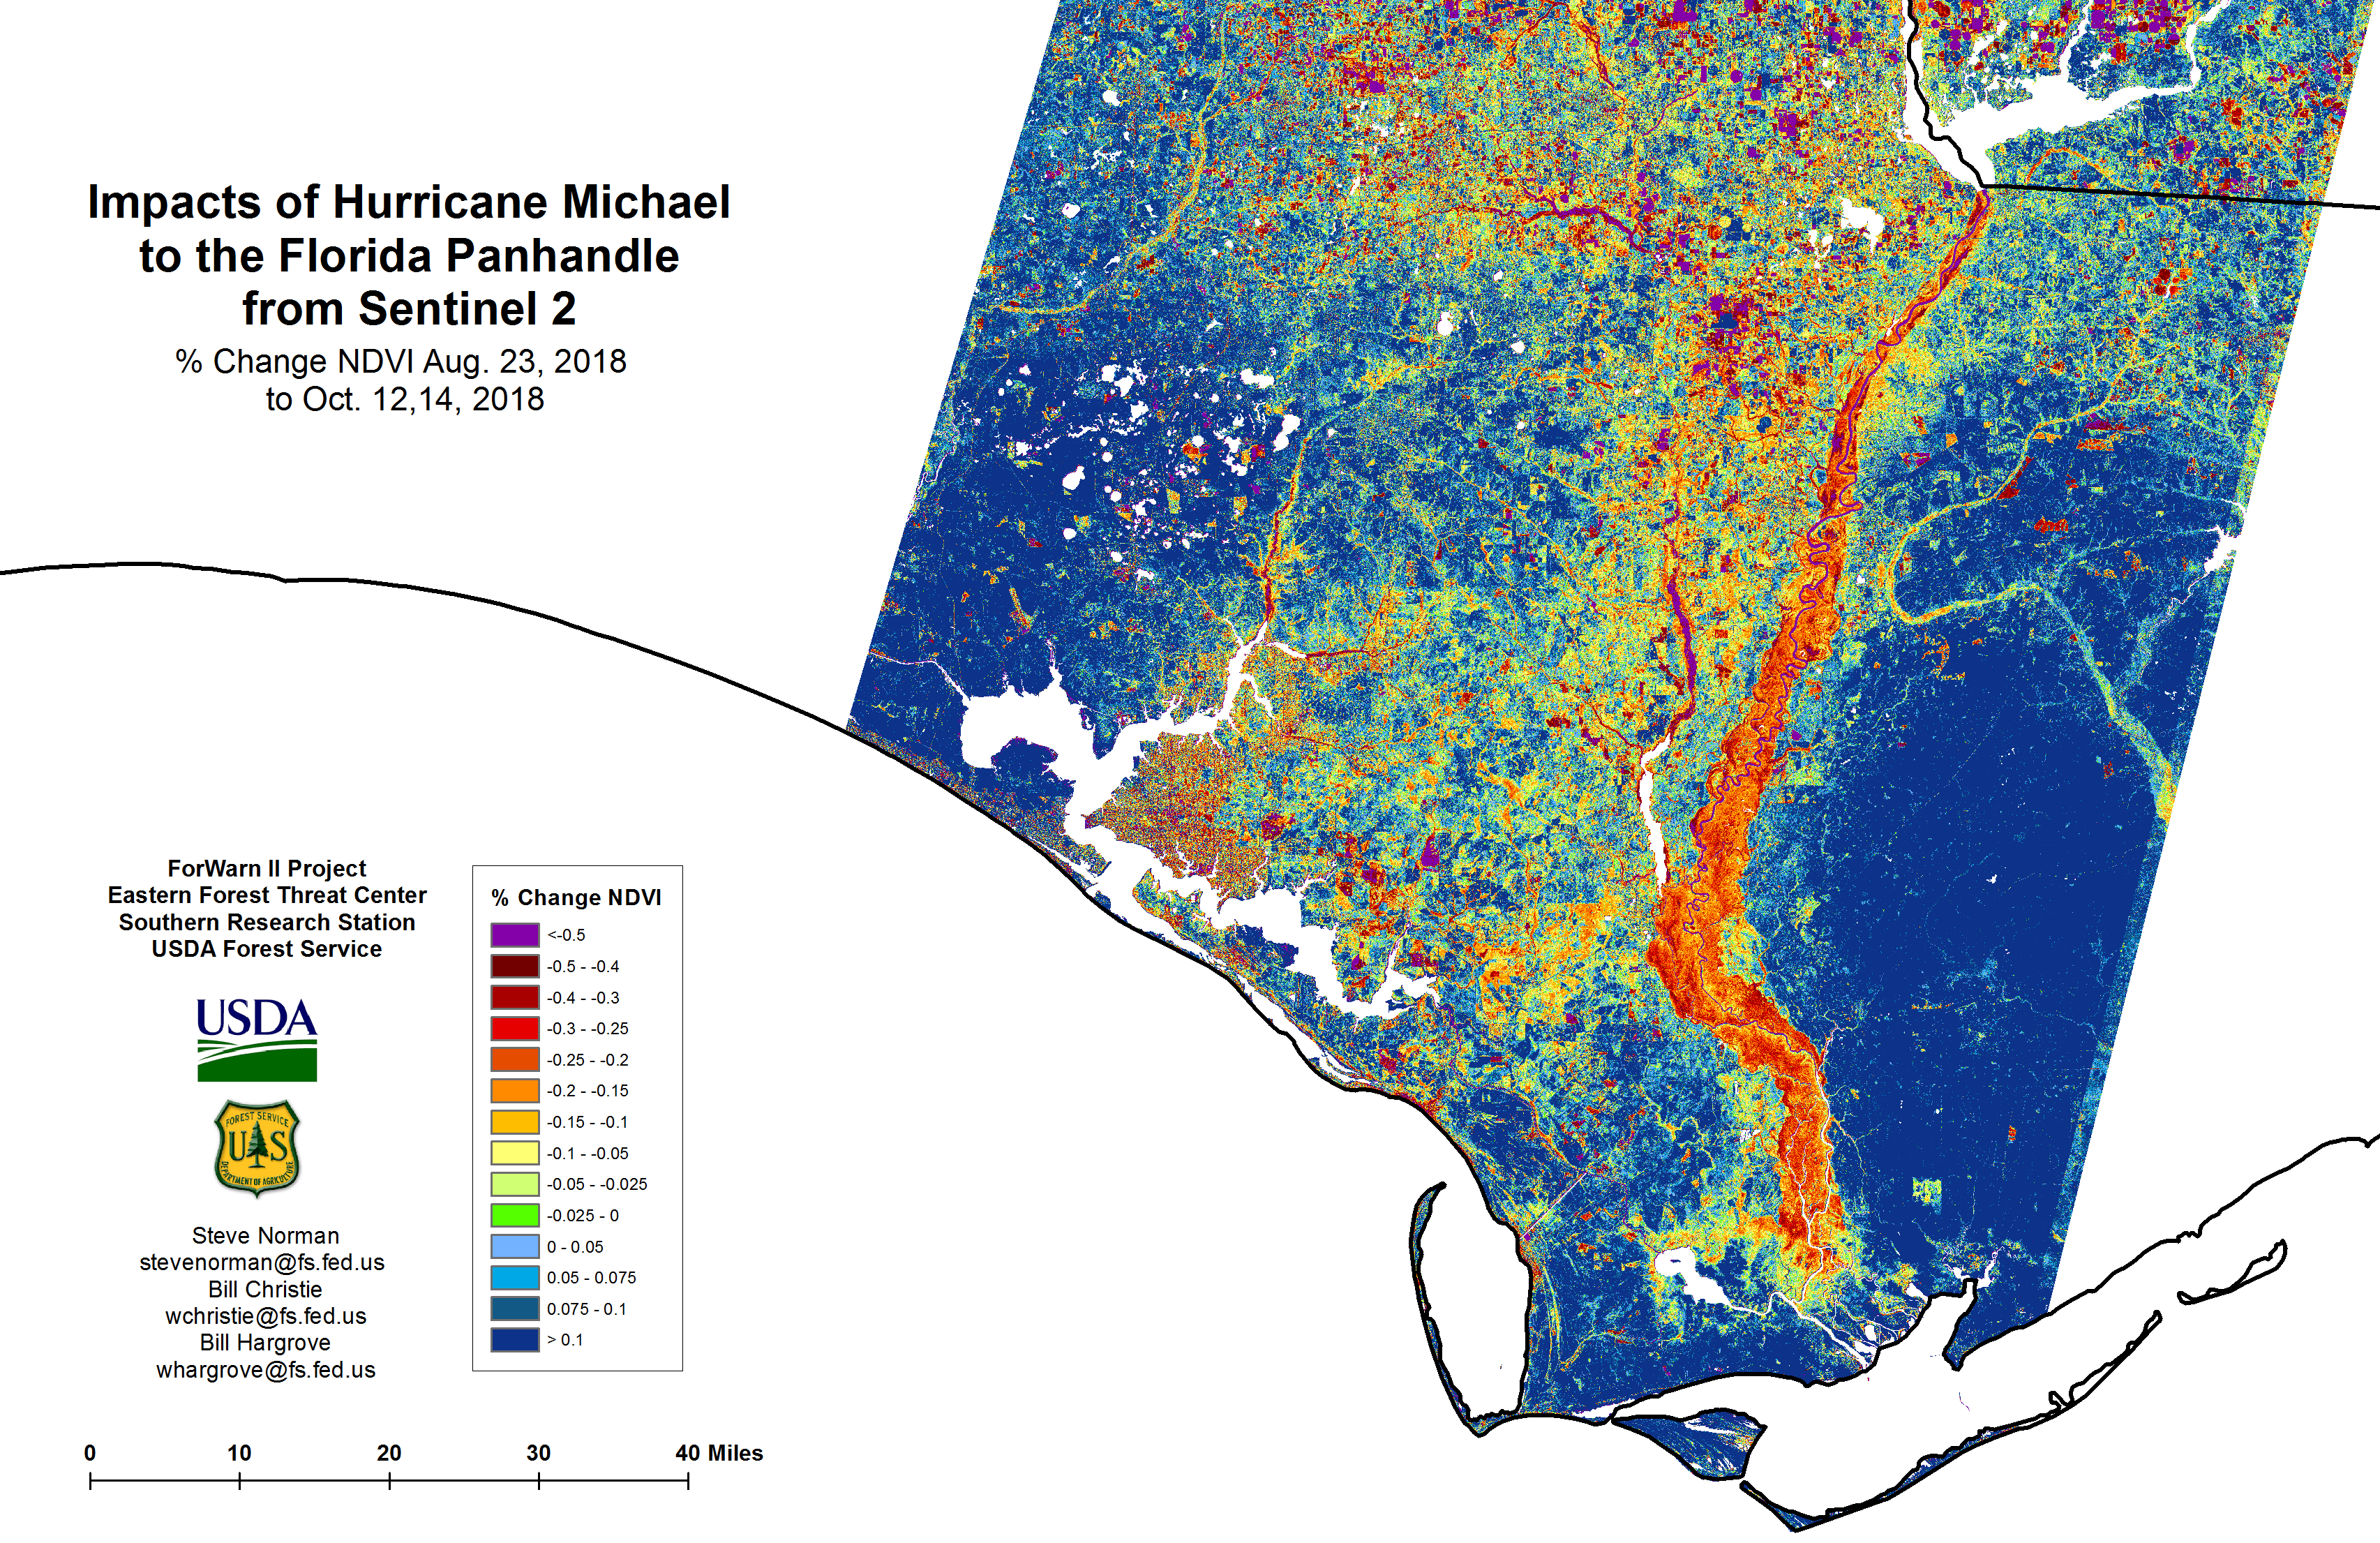
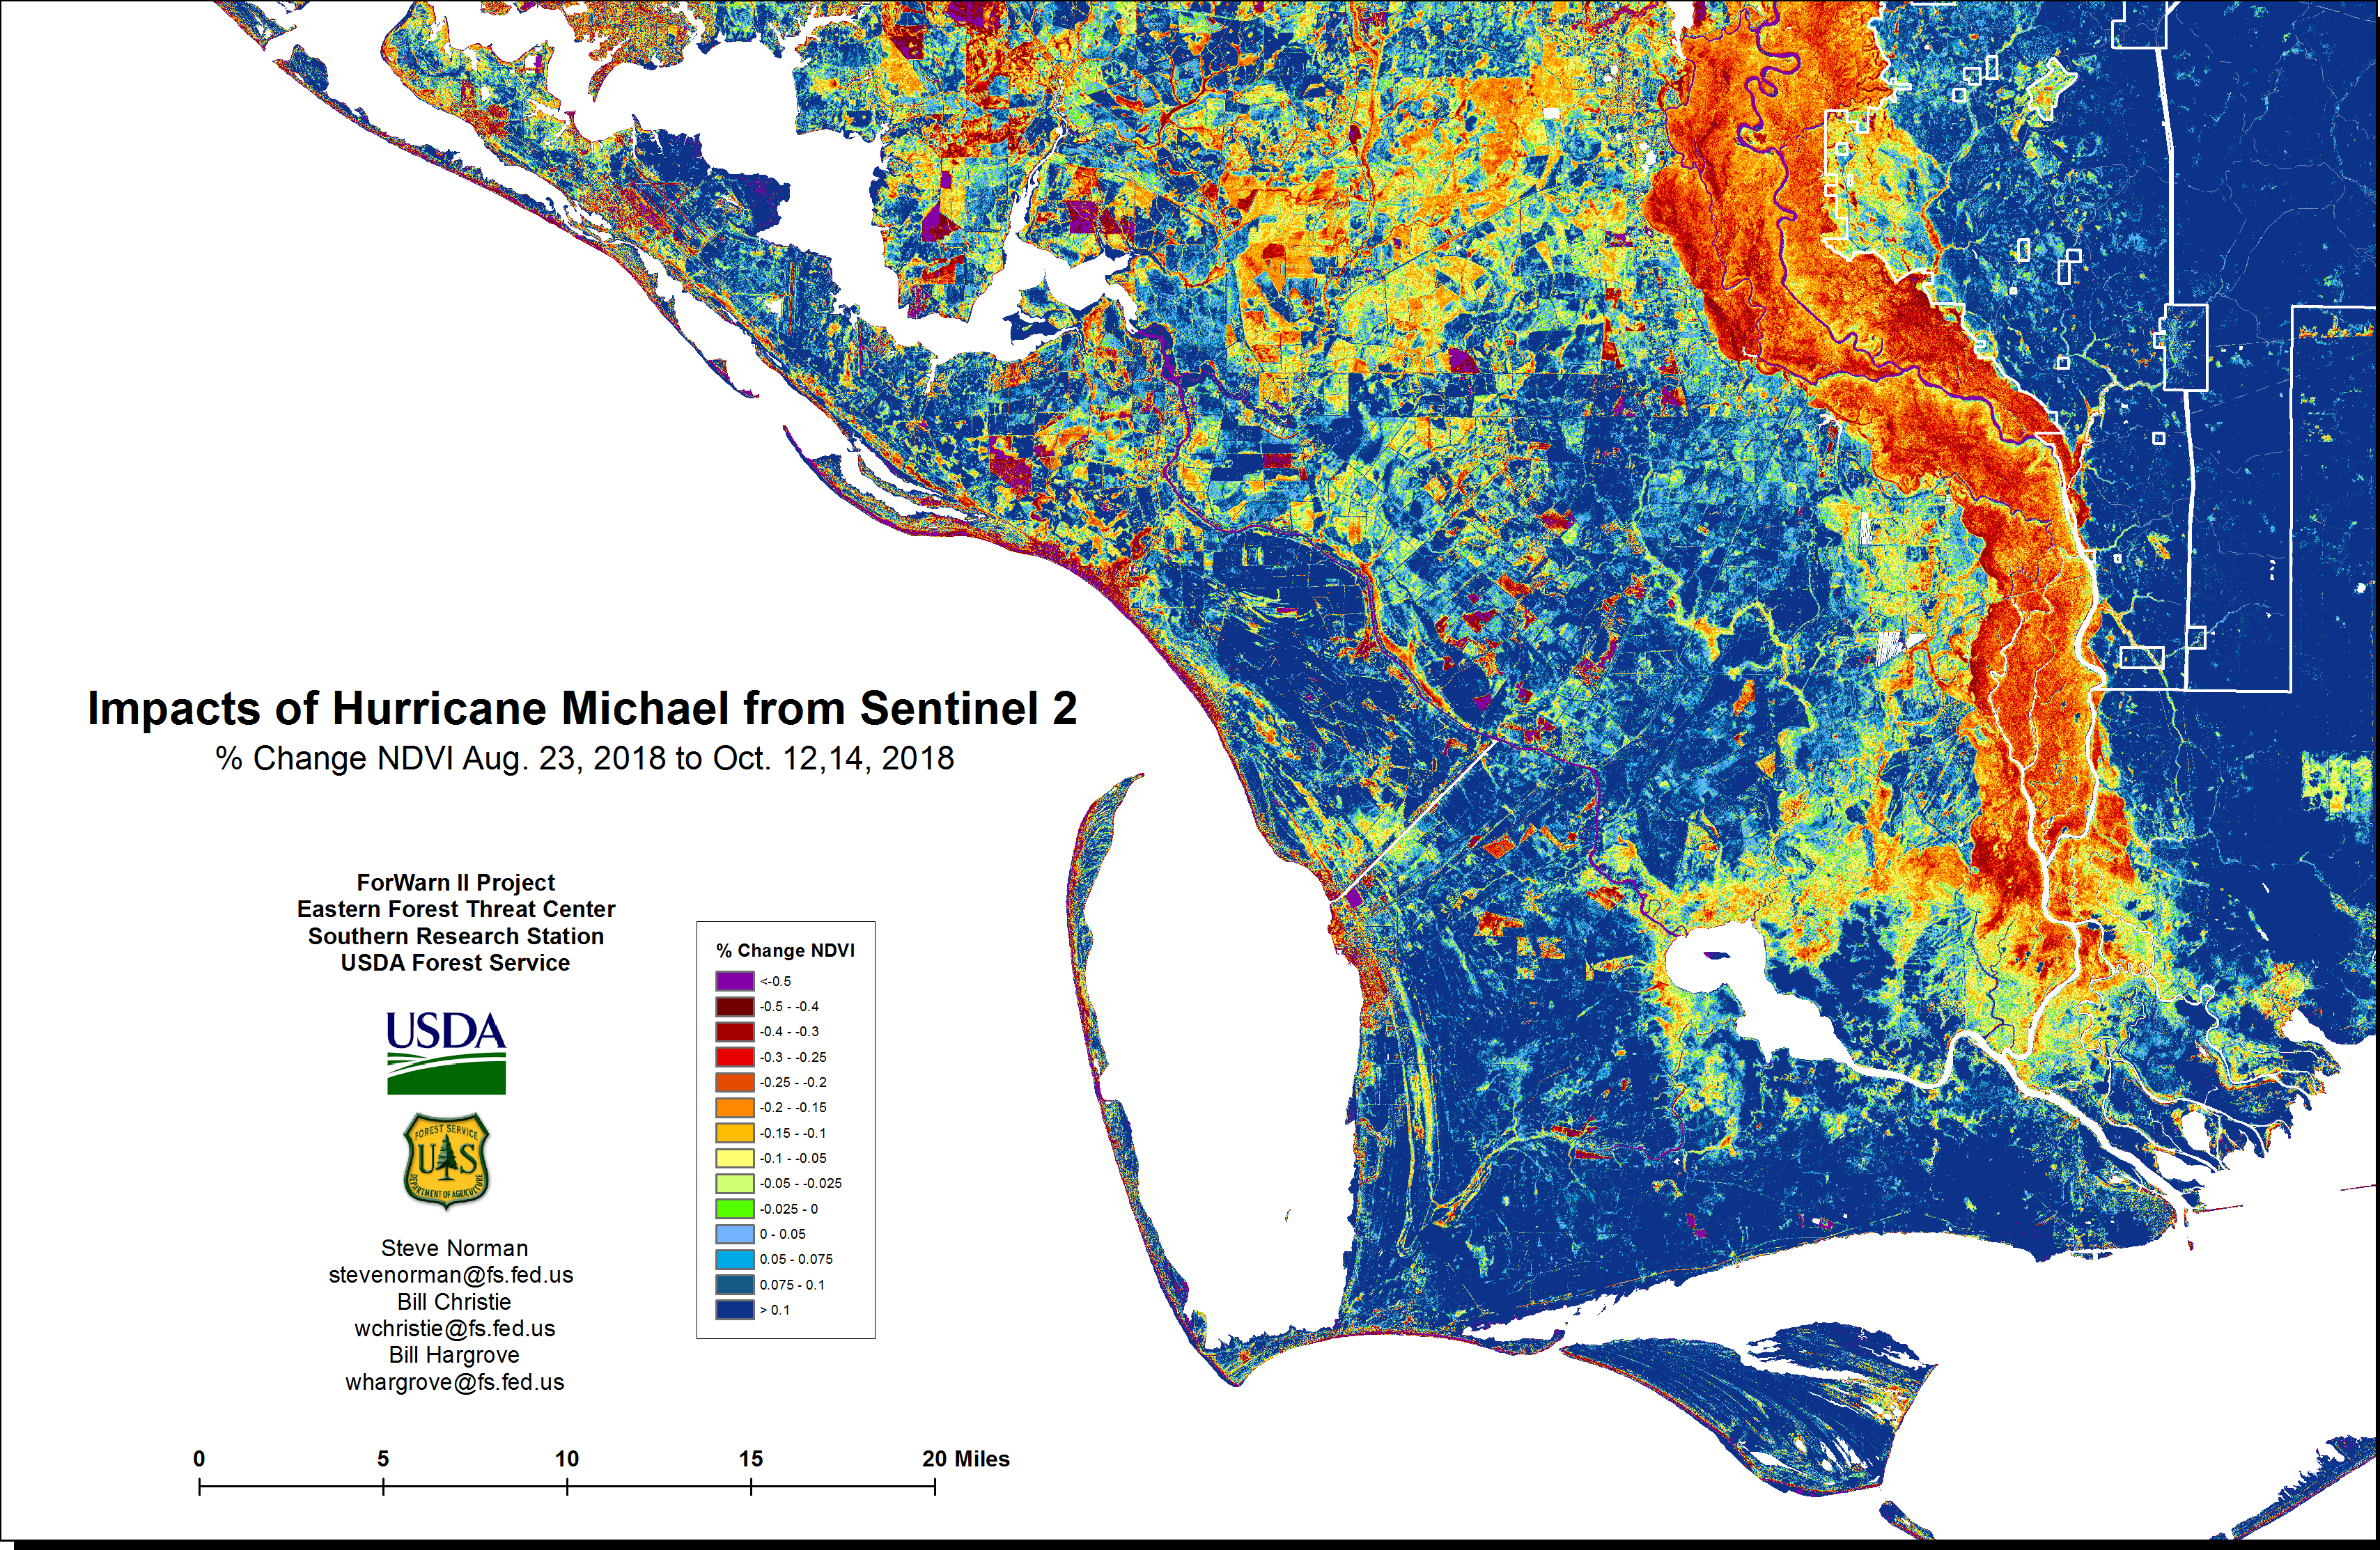
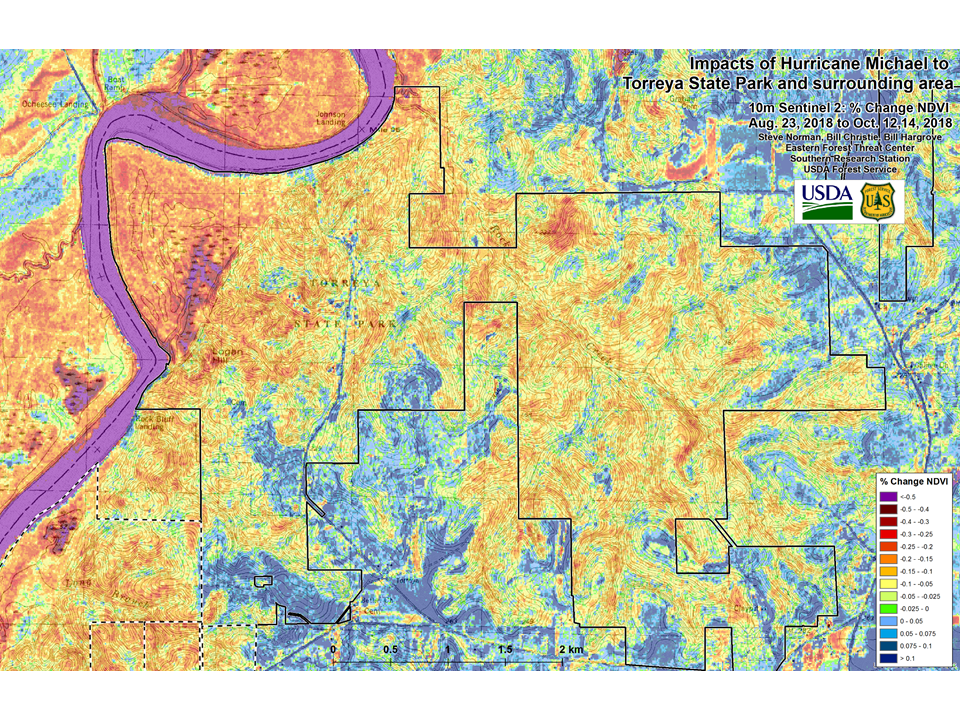
Sentinel 2 imagery is at 10 m resolution and it provides a comparison product for ForWarn II change products. The advantages of such high resolution are that damage to small groups of trees is evident as is the texture of damage within a stand. It also provides less edge and mixed land use issues. In many situations, timely Sentinel imagery is not available, but as shown here, a post-storm scene with very few clouds became available. Any later in the season, and there would be phenological issues with creating a same-year, pre/post change product and the baseline date used here is six weeks earlier than the post dates (August 2018). In contrast, ForWarn's baseline is a full year earlier, which works best when fall timing is comparable among years. The recency of the Sentinel baseline helps prevent some false positive declines caused by logging since 2017 that occur in the ForWarn product. You can explore the normal phenology of different areas using the multigraph tool on the ForWarn II viewer.
You can find georeferenced 10m resolution PDFs below that could be used with commercial software in the field for ground validation work in Panama City, Mexico Beach, the Chipola Experimental Forest and the Apalachicola National Forest.