ForWarn’s change products show NDVI departure from an eclectic mix of causes including climate stress, variation in the timing of seasons, biotic and abiotic disturbance agents, and successional recovery. At any given time, a complex of causes are often at work coincidentally in a landscape: wildfires often burn when vegetation is drought-stressed, logging and regrowth often occur in adjacent stands, and defoliation from storms or insects can occur in areas of active land cover change. Add to this the complication of year-to-year variability in seasonal transitions, and a landscape can harbor numerous anomalies, some of which have ready explanation while others, especially subtle differences, can remain uncertain.
Indicators of cause
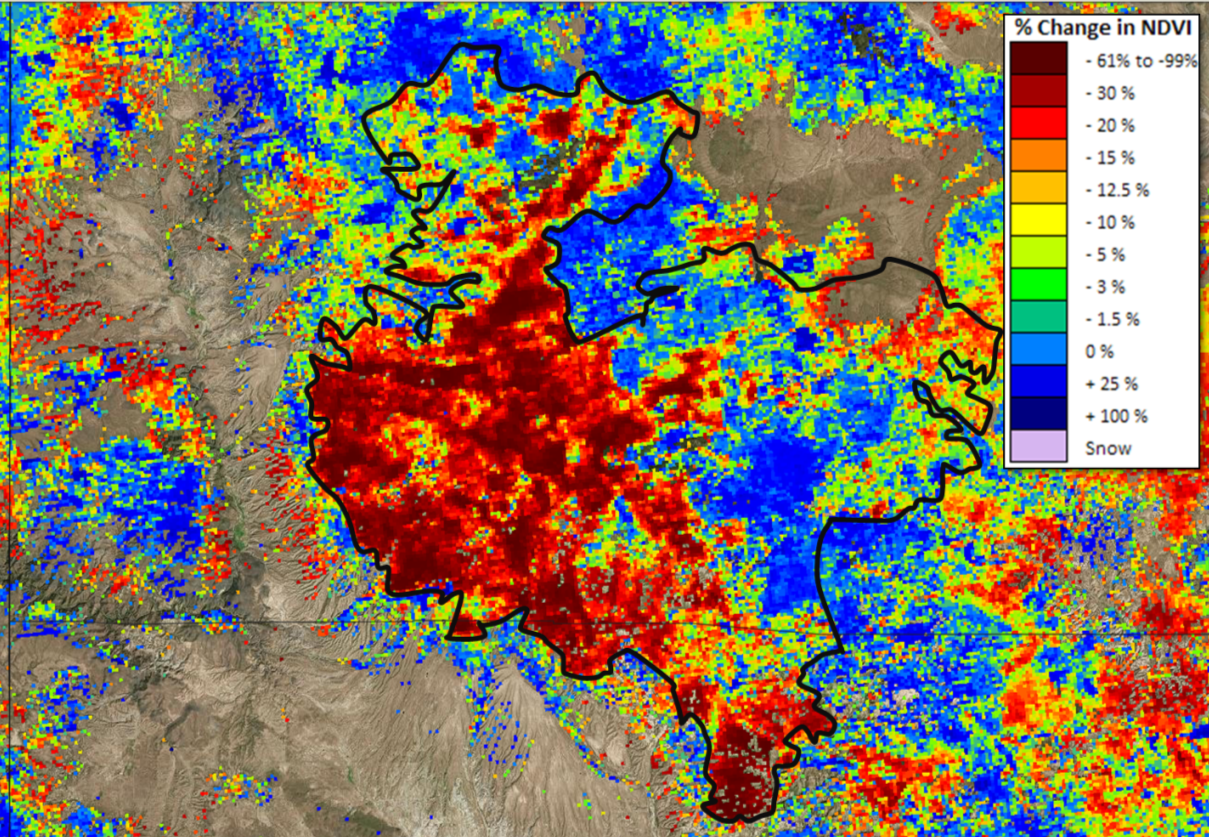
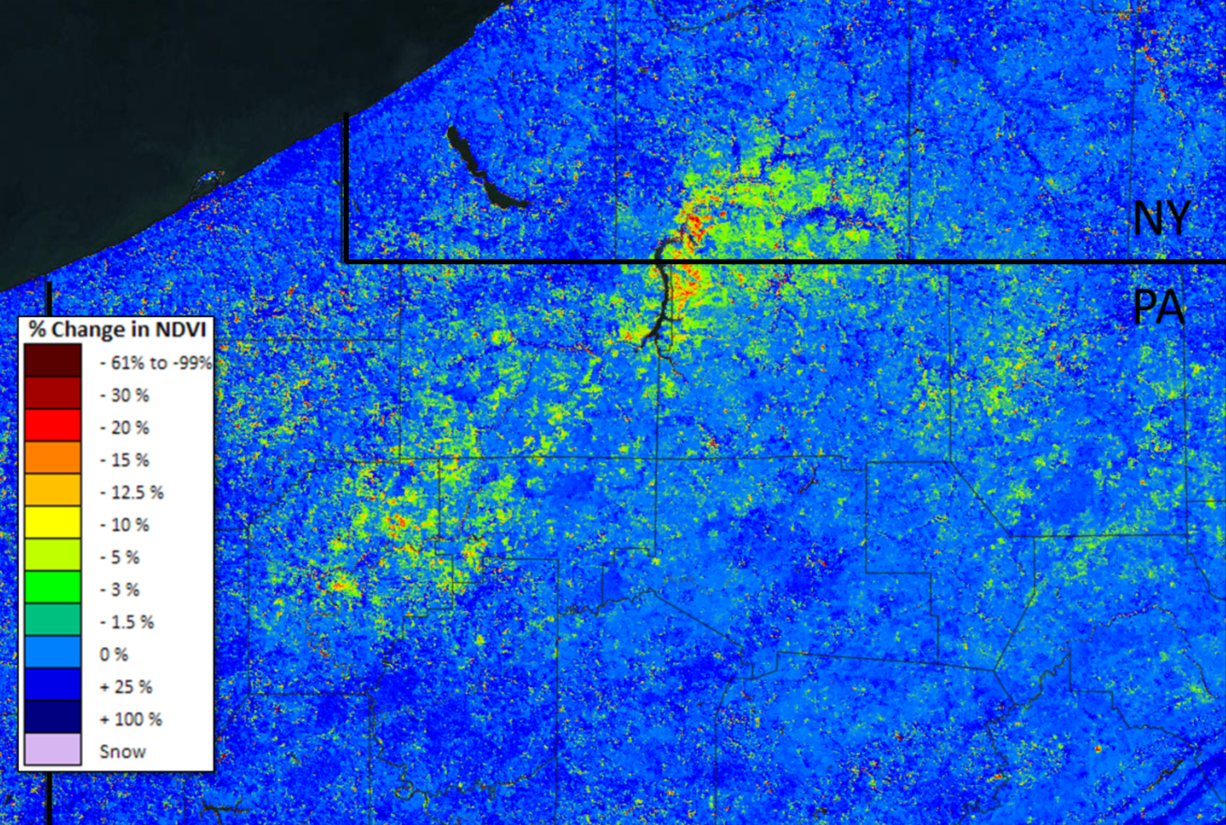
Extent—The spatial scale of an anomaly is the best indicator of whether the cause is some seasonal climate factor or disturbance. In that seasonal phenology curves are not entirely consistent from one year to the next, current conditions can be more or less green at any given period compared to baseline years. Early or late springs, summer drought conditions and anomalous snowpack create regional patterns that manifest themselves locally, often according to topography. The challenge for the interpreter is to recognize local anomalies as part of a larger phenomenon (Figures 1, 2, 3).

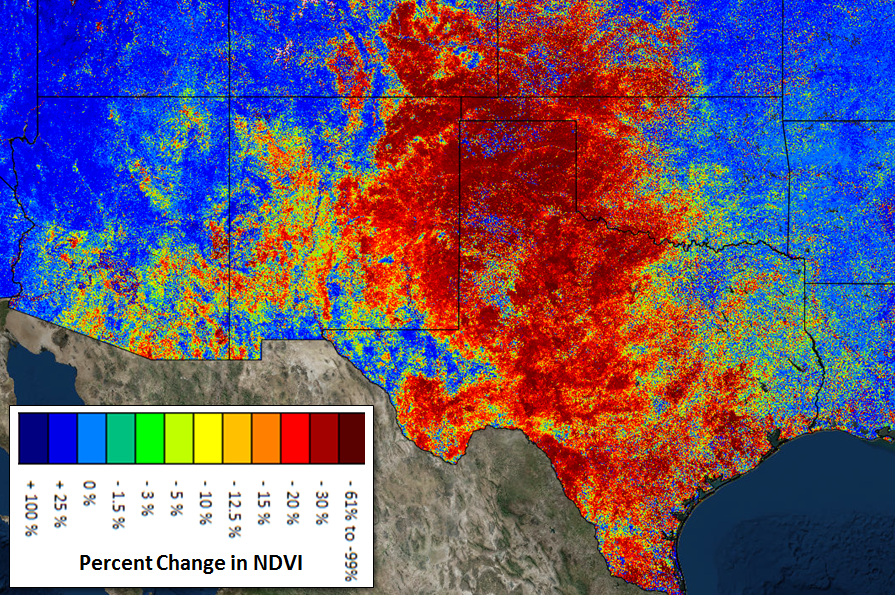
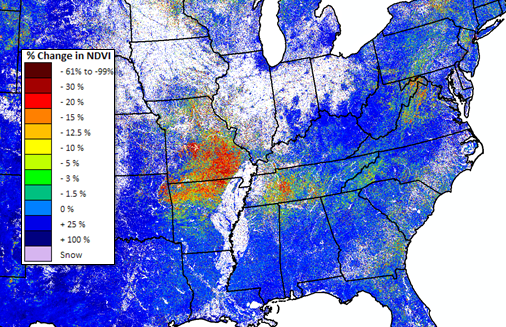
In the Western US, wildfires have grown in area in recent years so that they can affect moderate sized watersheds and landscapes. As the location of large disturbance events is generally well known from ancillary datasets, they are unlikely to be confused with the sub-regional scale of seasonal climate anomalies.
In general, the more local the anomaly, the longer the list of possible causes that should be considered. Regional climate factors can sometimes have local manifestations that with too close an inspection appear to be isolated. At local scales, logging, defoliation, fire or development are also among the possible explanations, so efficient assessments start by ruling out large-extent climate explanations.
Shape, edge and pattern of intensity—The structure of an anomaly within a landscape provides critical information about both the agent that caused it and the response of the vegetation. Responsiveness is often tied to vegetation type and topography, and these, along with other drivers such as insect population dynamics or fire weather contribute to pattern. Biotic and abiotic disturbances vary in the texture of their severity, as shown by the following examples:

Change behavior—The strongest asset of ForWarn is that because of its use of MODIS, it provides a continuous record of departure that allow analysts to explore the onset, developmental speed, spread and duration of change. This tool reveals changes that are short lived, or ephemeral, that could otherwise go unnoticed, such as leaf stripping events caused by insect defoliation, wind, ice, or low severity spring fire that can all be followed by leaf recovery.
When change is more severe, the onset speed or rate of change can be particularly revealing to interpret cause. For example, logging in an area can progress over the course of several weeks to months, while fire or storm effects are often immediate.
Individual insect defoliators often have a distinctive phenology of their own, so subtle differences in seasonal timing can reveal which of several possible candidates is present. Wildfire or prescribed fire seasons are also different from one region to the next, being more typically spring-associated in the east and a phenomenon of summer and fall in the West. Local or specialized knowledge is often critical for making sense of when causes are likely to be likely.
As a near-real-time emerging disturbance detection tool, ForWarn’s Early Detect product is particularly useful as it can detect change within a few days, clouds permitting. Persistence of the disturbance can also be a useful tool for characterizing disturbance behavior, as ephemeral disturbances, such as defoliation from hail in Spring, operate on much shorter time scales than more substantive disturbances that can cause tree mortality.
Expectations by cause
ForWarn’s viewer includes a broad suite of ancillary maps and data to help users diagnose the cause of observed changes using the indicators described above.
Early/late spring/fall—The onset and progression of spring is highly variable from year to year with a range of 3 weeks in much of the East. Fall is similarly variable, though often from different weather causes. During a late year in mountainous regions, anomalies show up elevationally, as there can be no anomaly from seasonal timing before or after the greenup transition period occurs. Anomalies often pass upward with elevation or northward latitudinally as the local spring wave passes according to this transitional sensitivity. Early fall onset is often triggered by a regional cold snap that affects broad areas more uniformly.
EXTENT: Regional to sub-regional
PATTERN: Consistent with topographic expectations
BEHAVIOR: Gradual to rapid anomalies in spring or fall
Drought--Drought is a sub-regional to regional phenomenon, but it can cause a finer scale patterned response due to the responsiveness of the vegetation present. In particular, open woodlands with a grass component are far more responsive to drought than is closed canopy conifer forest. Drought stress is persistent across periods, but can be alleviated after a single rain event. Tree or shrub mortality from drought can be subtle and impossible to recognize in near-real-time, and is particularly difficult to recognize when weather-sensitive grass is present and drought is persistent for more than a year; but detailed retrospective analyses can document this decline.
EXTENT: Regional to sub-regional
PATTERN: Strongest on exposed sites with drought-sensitive vegetation
BEHAVIOR: Very gradual onset; persistent for several periods
Insects, pests and diseases--Insects and diseases have wide ranging effects related to the phenology of the host species and agents involved. Damaging insects are often revealed by the timing of the outbreak and the topographic position or vegetation type affected.
EXTENT: Regional to sub-regional
PATTERN: Conforms to host distribution; often irregular or measles-like
BEHAVIOR: Often a gradual onset; ephemeral to persistent, depending on the season and severity
Wind or hail–Wind storms often produce a complex array of impacts that can confound NDVI detections. Leaf stripping is most common, and if the storm occurs in spring, trees can regrow the leaves lost or other vegetation on the site can compensate and fill the void. The specific type of storm changes expectations, as a hurricane or derecho can affect a broad area while tornadoes, straight-line winds or local downbursts are often localized.
EXTENT: Local, landscape, to sub-regional, depending on type
PATTERN: Conforms to storm behavior; tornadoes are linear, hurricanes are diffuse
BEHAVIOR: Sudden onset; ephemeral to persistent, depending on the season and severity
Wildland fire--The responsiveness of MODIS NDVI to fire varies considerably according to the fire’s impact on understory and overstory foliage. In many systems, loss of foliage need not be an indicator of mortality, as grass and many shrubs resprout. Relative mortality of conifer cover is indicated by change in the non-snow winter (evergreen) NDVI, while the deciduous fraction is indicated by the increase over winter’s value. These fractions often change pre- and post-fire.
EXTENT: Local to landscape
PATTERN: Variable depending on patch severity and prior vegetation responsiveness
BEHAVIOR: Sudden onset, but often with progressive landscape behavior; usually persistent
Logging—Clearcut logging patches are usually nearby other cutting unit, particularly in industrial timber lands. Even-aged conifer plantations have rows of trees, suggesting commercial timber land use. Selection logging or restoration treatments that use thinning open the canopy which results in less change than seen with clearcut logging. Either can increase the importance of drought sensitive understory, particularly when conifers are being removed. Large patches often emerge over the course of several weeks to months as groups of trees are successively removed.
EXTENT: Local
PATTERN: Patches are of equal size to phenomenon observed on aerial photos
BEHAVIOR: Gradual development; lasting impacts
Development-- Urban development tends to be associated with new or existing roads and near previously developed areas; but ridgeline wind turbines and gas wells can cause change in more remote areas. NDVI drops can appear progressively, with tree removal followed weeks to months later by bare soil excavation. After development is complete, NDVI eventually achieves a reduced stable state given the mix of vegetation, structures and infrastructure on the site.
EXTENT: Local
PATTERN: Blocky to linear
BEHAVIOR: Gradual onset; permanent impacts
Succession--ForWarn’s ability to track vegetation recovery is among its greatest strengths, and this shows up in ForWarn’s change imagery as two shades of blue when conditions are compared with post-disturbance years. It is common to see transitions in both overall NDVI and the phenological profile which suggests changes in vegetation type, such as succession from grass, to shrub, to more conifer dominated stands.
EXTENT: Local to landscape, consistent with the prior disturbance
PATTERN: Consistent with disturbance or topographic controls
BEHAVIOR: Gradual with a multi-year progression
Clouds (false positive)--ForWarn’s 24-day data-collection window effectively removes most clouds and cloud shadows, however some 24 day periods lack even a single day without clouds and this artificially reduces NDVI values. The Viewer includes two different True Color cloud assessment products that show natural color at 1km resolution for the 1 year standard and 1 year Early Detect products. Look for white or grey on the Viewer’s True Color maps.
EXTENT: Local
PATTERN: Small patches; randomly occurring or in cloud-prone areas
BEHAVIOR: Usually ephemeral
For an additional discussion of available ancillary datasets and links, look under Overview/Datasets for Assessment Support.