Remote sensing with MODIS
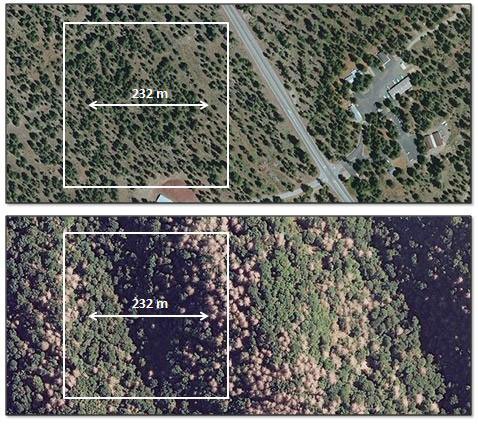
The Terra and Aqua satellites that house the Moderate Resolution Imaging Spectroradiometer (MODIS) pass overhead daily, and this greatly increases the likelihood that there will be an unobscured view of the surface every few weeks. Frequent passes mean within-season vegetational change is within our grasp, and thus we’ve gained the ability to monitor growth and disturbance as they progress or occur. The tradeoff of MODIS is its lower spatial resolution than higher resolution imagery, such as Landsat, as there are roughly 64 Landsat grid cells for each MODIS grid cell, which is effectively 232m on a side, or 5.4 hectares (13.3 acres) (Figure 1).
Since the 1970s, 30m imagery from Landsat spacecraft has become an invaluable way to track change in landscapes. Currently, Landsat 7 and 8 remain operational, but Landsat 7 has partial data loss. Each satellite’s 16 day flyovers often fail to capture a clear look at the surface vegetation because of cloud cover. In areas of persistent clouds, months can pass before a satellite overpass coincides with a chance clear sky. For many science applications, this wait is tolerable, especially given the benefits that come from high spatial resolution.
This difference in resolution between Landsat and MODIS has considerable practical implications for data processing and product delivery. The conterminous US is covered by 146 million MODIS grid cells, but 9.3 billion Landsat grid cells. To have a consistent near-real-time national product that is efficiently distributed, the ForWarn system relies on a highly processed MODIS daily feed.
The resolution of MODIS is such that each cell typically includes dozens to hundreds of individual trees along with understory vegetation when it is not obscured by the canopy. The top image below shows a mix of grass and young ponderosa pine trees in Lassen National Forest, California, and the bottom image shows eastern hemlock mortality in the Pisgah National Forest, North Carolina. At this moderate resolution, nearly every cell’s NDVI values measure a mix of species or types of plants.
The Normalized Difference Vegetation Index (NDVI)
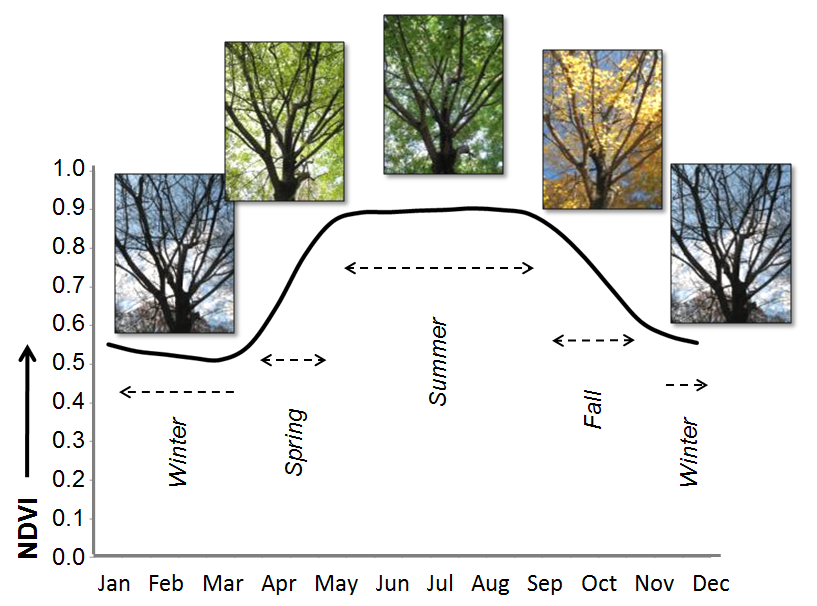
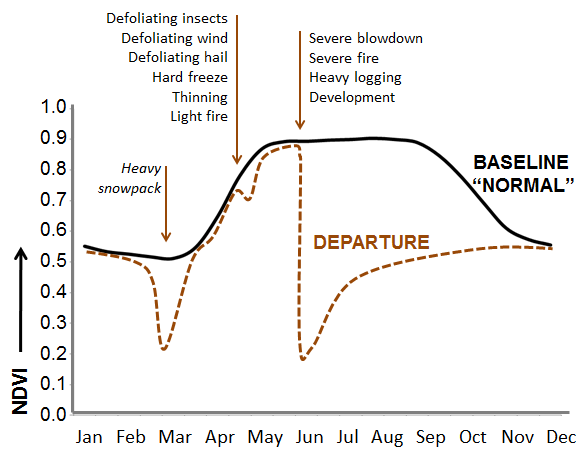
From the array of wavelengths that MODIS collects, ForWarn relies on the red and near infrared to calculate the Normalized Difference Vegetation Index (NDVI). In combination, these wavelengths help identify where leaves are thriving and where they are absent or under stress based on how much they are photosynthesizing, as stressed vegetation reflects more red wavelengths than does healthy vegetation, with a reversed reflectance relationship in the near infrared. Because the photosynthetic activity of trees and forests is connected to environmental variables such as season, rainfall, temperature, and disturbance-associated stressors, NDVI measures the impact of all of these factors on vegetation. As such, it provides a generic tool for tracking seasonal vegetational transitions, disturbances and recovery (Figure 2).
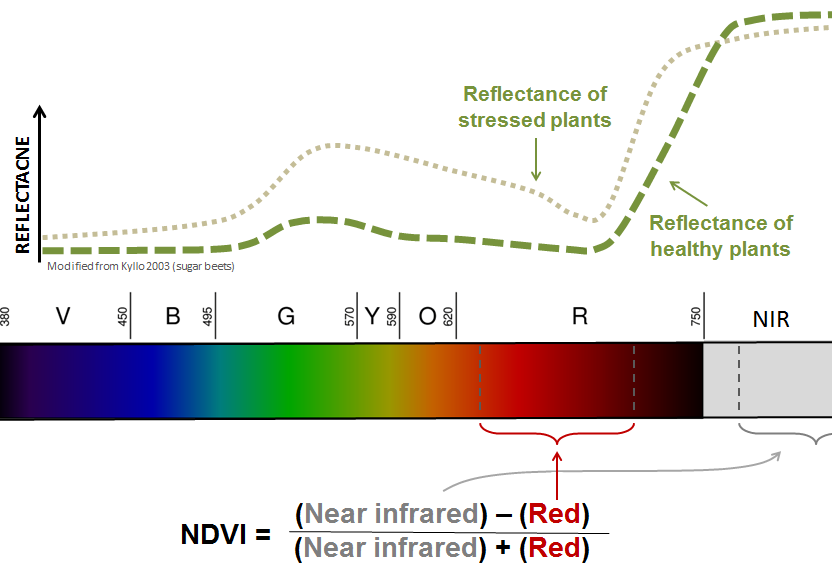
At MODIS resolution, NDVI is a composite measure of all the vegetation that is visible from above. In dense forests during the growing season, this includes leaves of the species that comprise the canopy. In open forests, NDVI captures canopy trees and understory species in gaps. In deciduous forests, winter NDVI may include understory evergreen vegetation that is masked by trees in summer. Given the differences in phenology among understory and overstory species that may comprise a forest, NDVI measurements that cross seasons can include a complex sample of a forest’s structural and compositional attributes.
ForWarn’s 8 day NDVI time series uses a moving window that is 24 days long to help ensure a cloud-free, smoke-free and as much as possible, a snow-free view in winter. Where snowpack is persistent, this time series dataset interpolates through these problematic periods of time. These show up on the NDVI time series as linear interpolations and are common in areas of dense snowpack in winter, such as the northern tier of the US and high elevation mountains of the West. ForWarn’s viewer provides access to 46 NDVI values per year for the entire conterminous US since 2000, when MODIS data collection began.
Land surface phenology
As applied to plants, the science of phenology addresses the seasonal timing of biologically significant behavior of species, such as spring emergence, budburst, flowering and leaf senescence. Land surface phenology (LSP) is a somewhat different concept that reflects more generalized remotely sensed observations of seasonal growth and environmental responses of vegetation rather than individual species in most cases. LSP relates to vegetation rather than species because remotely sensed imagery is of coarse resolution that includes the dynamics of multiple canopy or understory species. At MODIS resolution, the vegetational signal may reflect the contribution of dozens of species and, depending on the site characteristics, from dozens to innumerable individual plants. Because of that, it is useful to think of every 5.4 ha MODIS pixel as mixed with potentially complex responses to seasonal climate change, seasonal growth, and disturbance.
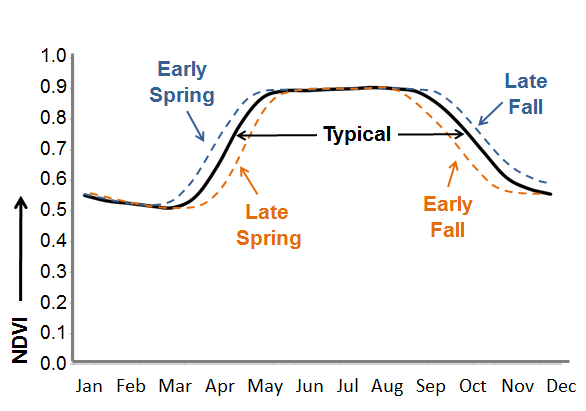
LSP has a central role in ForWarn’s approach to change detection because the expected or normal NDVI values at a location are constantly changing as the constituent species at a site greenup or senescence according to their different life strategies. Continuous seasonal adjustments to baselines are needed to recognize disturbances during seasonal transition periods, and this is particularly difficult when spring or fall are earlier or later than for a given baseline (Figure 3).
