The typical start of greenup in natural vegetation


More information about this event
The start of the annual growing season is among the most important climate-sensitive measures that Land Surface Phenology (LSP) products like ForWarn can provide. Warm temperatures can accelerate bud burst, and this can increase exposure to damaging spring frosts, as it did across the Southeastern US in 2007 and 2012. In natural areas, the timing of spring greenup can affect growing season duration and productivity. It can also affect the risk and impacts of disturbances, such as those from wind, hail and fire. Moreover, the timing of many leaf defoliators is tied to greenup, and knowledge of when leaves are emerging can be used for planning insect and disease surveys. Just as gardeners look to climate data to determine the typical last frost date, the typical start of greenup date provides a baseline for establishing expectations of the normal onset of greenup to compare conditions across years.
In contrast to field observations that track leaf emergence for selected trees or herbaceous plants, ForWarn's LSP-greenup captures the response of all vegetation that can be seen from space. In many ecosystems, this could be hundreds of species and thousands of individuals, each contributing their proportionate share of greenness for the MODIS satellite instruments to detect. In the summer, this includes all the canopy species over the 13 acre grid cell, and prior to canopy greenup it includes understory species as well.
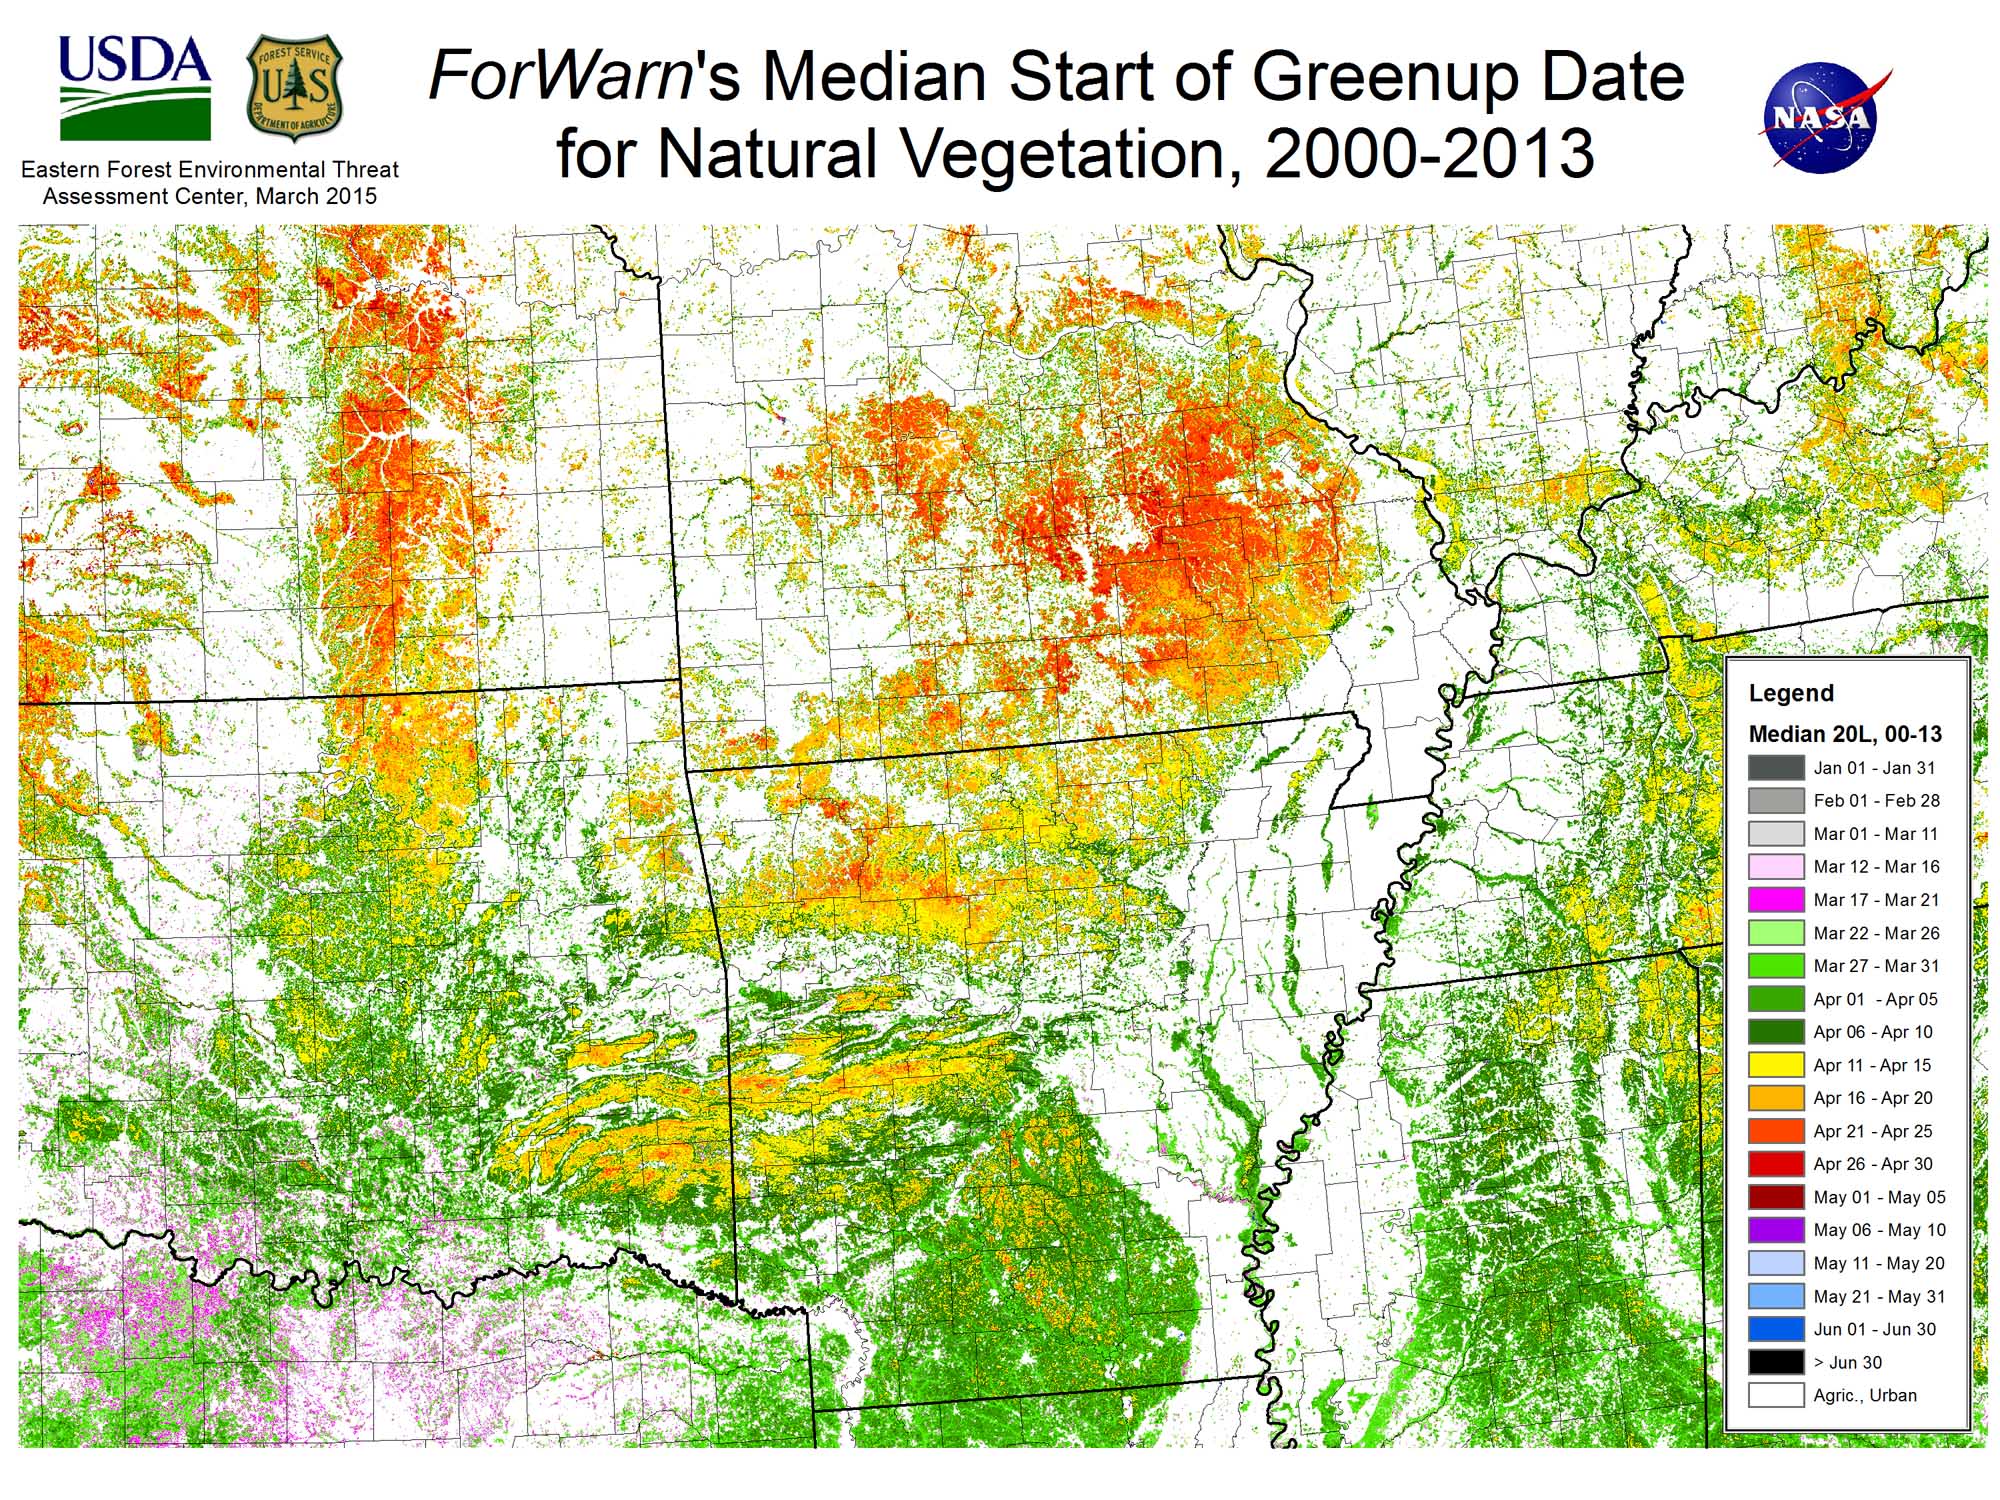
ForWarn models seasonal change, including the start of greenup with seven annual parameters as shown on slide 2. On the left (early) side of the phenological curve, parameters include the late winter minimum NDVI, the growing season maximum (of summer) and the 20th and 80th percent of greenup. The 20th percent is based on change from the minimum to the maximum NDVI, and it is calculated separately for each of ForWarn's 146,000,000 cells. This results in 146,000,000 estimates of the day and NDVI value for the start of greenup each year. The maps shown here show the median 20 Left day of year of greenup for the 14 years from 2000-2013. The median is a more accurate measure of central tendency than the average as the median reduces the chance influence of extreme early or late years and the undesirable influence of snow pack on the winter minimum.
The usefulness of this LSP start of greenup model across the US varies with winter snow pack and vegetation type. By definition, evergreen vegetation types have no start of greenup. Extreme desert areas may also have constant NDVI values year-round, at least in most years. In the southwestern US, start of greenup can be late in the calendar year, causing problems of non-conformity with how spring or greenup is conceptualized as depicted on slide 2. In areas of heavy and persistent snow, 20 Left can be artificially early because it often reflects snow melt that covered evergreen vegetation prior to the start of spring. This phenomenon occurs in portions of the Allegheny Plateau of central Pennsylvania, the Adirondacks, New England and high latitude mountain areas of the Pacific Northwest. To know the limitations and applicability of this start of greenup model for specific areas of interest, explore the NDVI history on the ForWarn viewer.
__________
See also:
Start of greenup on agricultural lands: http://forwarn.forestthreats.org/highlights/918
Start of greenup in urban areas: http://forwarn.forestthreats.org/highlights/919
References
For local reports of species specific observations and a coarse climate-based predictive model check out Project Budburst at http://budburst.org/
Compass Live story: http://www.srs.fs.usda.gov/compass/2015/04/02/forest-service-researchers...